Gold Price Forecast: XAU/USD holds ground around $2,500

XAU/USD Current price: $2,502.15
- Treasury yields trimmed early gains, weighing on the US Dollar.
- Market participants await the release of the US Consumer Price Index on Wednesday.
- XAU/USD battles to extend gains beyond $2,500 as bulls paused.
Spot Gold trades just around the $2,500 mark, unchanged on Monday and confined to a tight intraday range. The bright metal peaked at $2,505.18 early in the American session, as Treasury yields started the day with a positive footing. The United States (US) 10-year note peaked at 3.76% but then trimmed gains and currently stands at 3.70%.
The US Dollar remained resilient throughout the first half of the day, extending Friday’s NFP-inspired gains. The poor performance of Asian indexes added to USD strength, which receded mid-European session, as local shares managed to post gains, underpinning Wall Street ahead of the opening.
Financial markets are waiting for US inflation data, as the country will release the August Consumer Price Index (CPI) next Wednesday. The index is foreseen up by 2.6% on a yearly basis, easing from the 2.9% posted in July. The core annual reading, however, is expected to remain unchanged at 3.2%.
Following the release of the Nonfarm Payroll (NFP) report, speculative interest lifted bets the Federal Reserve (Fed) may opt for a 50 basis points (bps) rate cut when it meets next week. Cooling inflationary pressures will add to such speculation.
XAU/USD short-term technical outlook
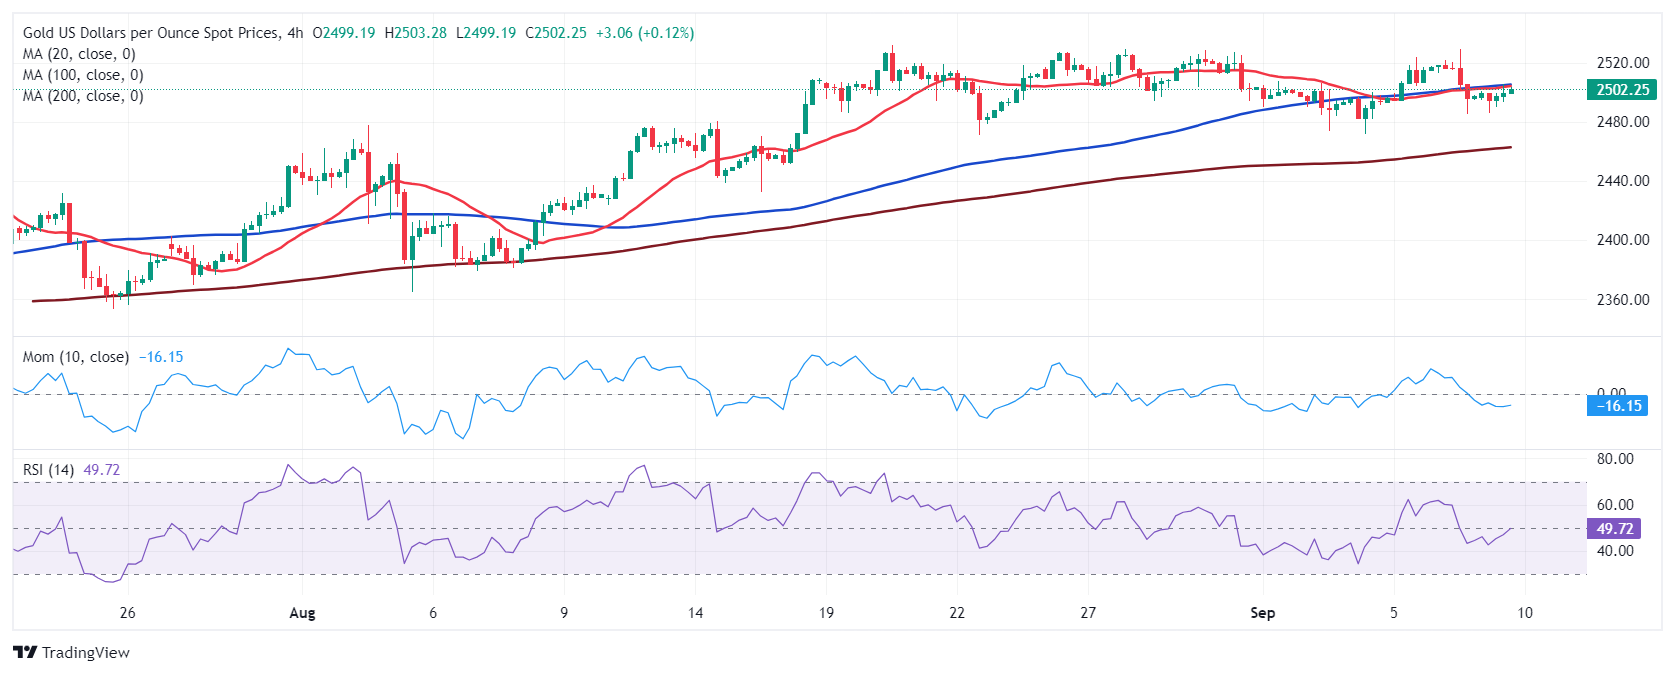
From a technical point of view, the daily chart for XAU/USD shows bulls hold the grip but stay cautious. The pair is currently hovering around a mildly bullish 20 Simple Moving Average (SMA), with buyers quickly adding on dips below the media. At the same time, technical indicators hover around their midlines without clear directional strength. Finally, the longer moving averages maintain modest bullish slopes far below the current level.
The near-term picture is neutral-to-bearish. Converging 20 and 100 SMAs provide resistance around the aforementioned intraday high, while the 200 SMA aims north at around $2,465. The Momentum indicator aims lower at around its midline, skewing the risk to the downside without confirming it. Finally, the Relative Strength Index (RSI) indicator holds directionless at around 50, lacking directional strength.
Support levels: 2,489.60 2,475.70 2,461.50
Resistance levels: 2,507.60, 2,519.75 2,531.60
Premium
You have reached your limit of 3 free articles for this month.
Start your subscription and get access to all our original articles.
Author

Valeria Bednarik
FXStreet
Valeria Bednarik was born and lives in Buenos Aires, Argentina. Her passion for math and numbers pushed her into studying economics in her younger years.


