Gold Price Forecast: XAU/USD holding below $3,650 ahead of US inflation data

XAU/USD Current price: $3,645.87
- Geopolitical tensions in the Middle East pushed Gold to fresh all-time highs.
- United States updates on employment and inflation critical ahead of Fed’s announcement.
- XAU/USD may correct after reaching records, but buyers aim for higher highs.
Spot Gold kept rallying to record highs on Tuesday, reaching $3,674.63 early in the American session. The run was triggered by headlines indicating that Israel launched an attack on Qatar, targeting Hamas leaders, including Khalil Al-hayya and Zaher Jabarin. Israeli media reported that the United States (US) was notified before the attack, while Qatari authorities called the attack a flagrant violation of international law.
The XAU/USD pair retreated from the aforementioned peak following the release of the US revision to employment data. The Bureau of Labor Statistics (BLS) reported that the Current Employment Statistics (CES) national benchmark revision to total Nonfarm employment for March 2025 is -911,000, or -0.6%. The US Dollar (USD) initially fell with the news, but quickly changed course and resumed its advance, trading with modest gains against most major rivals. As for Gold, the bright metal is stable just below the $3,650 mark.
Market players will now turn their eyes to the United States (US) inflation data. The country will release August Producer Price Index (PPI) figures on Wednesday, and Consumer Price Index (CPI) data for the same month on Thursday. Inflation data will gather extra attention following dismal employment figures and ahead of the Federal Reserve (Fed) monetary policy announcement next week.
XAU/USD short-term technical outlook
The daily chart for the XAU/USD pair shows that it holds on to modest intraday gains, while still extremely overbought. The Momentum indicator is easing modestly from extreme levels, while the Relative Strength Index (RSI) indicator keeps grinding higher at around 80. At the same time, the pair is developing far above all its moving averages, with the 20 Simple Moving Average (SMA) accelerating north above mildly bullish 100 and 200 SMAs.
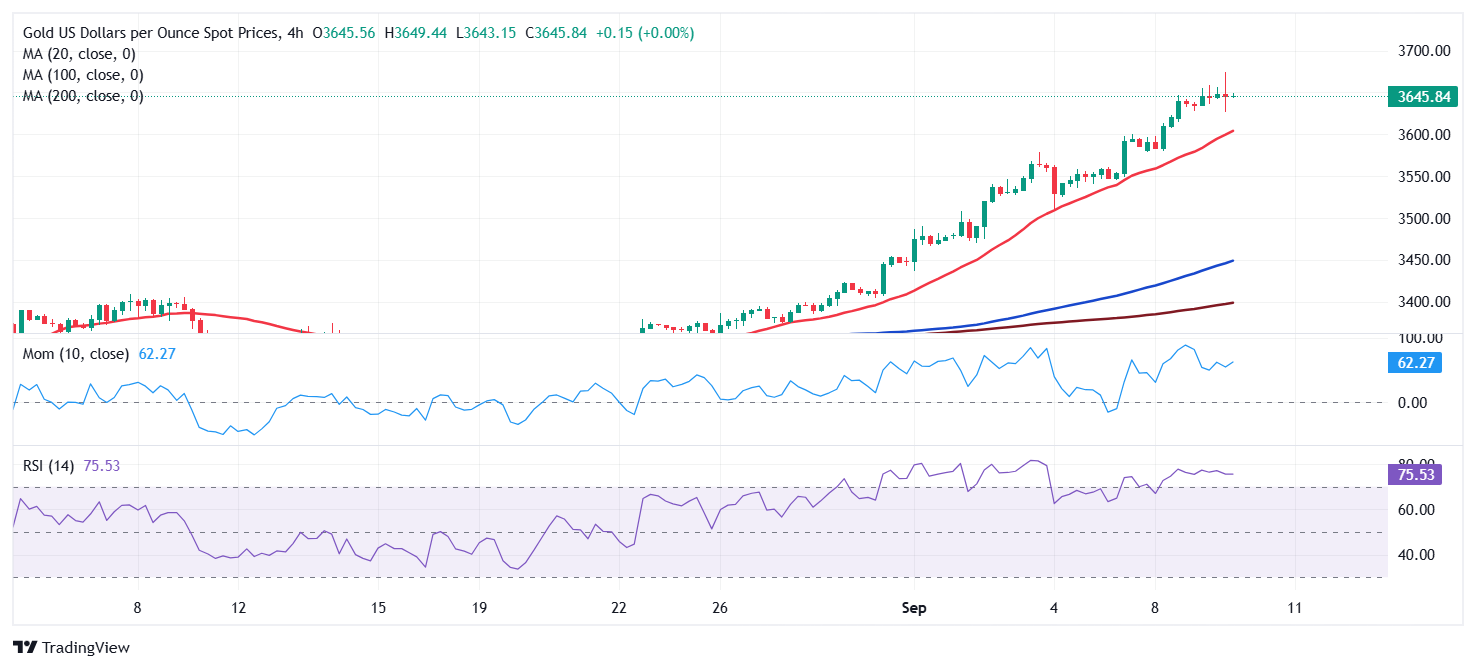
The 4-hour chart shows that technical indicators have retreated from their recent extreme peaks, but also that they hold within overbought levels. The downward potential remains well-limited, as indicators retreated by more than price, still far from being considered a divergence. Finally, a firmly bullish 20 SMA stands at around $3,604, still advancing far above the longer ones, which also aim north.
Support levels: 3,638.10 3,625.85 3,608.40
Resistance levels: 3,650.00 3,675.00 3,690.00
Premium
You have reached your limit of 3 free articles for this month.
Start your subscription and get access to all our original articles.
Author

Valeria Bednarik
FXStreet
Valeria Bednarik was born and lives in Buenos Aires, Argentina. Her passion for math and numbers pushed her into studying economics in her younger years.


