Gold Price Forecast: XAU/USD has room to rise towards $1,990 amid Ukraine woes, bullish technicals
- Gold bulls eye more gains amid a prolonged Ukraine crisis, inflation concerns.
- Bullish RSI and symmetrical triangle breakout on the 4H chart buoy gold price.
- Incoming Ukraine updates, US data and Fedspeak eyed for fresh trading impetus.

Are gold bulls prepping up to resume their uptrend towards the March highs of $2,070? Well, not so fast, although the recent upside seems to have legs. The Russia-Ukraine conflict rages on and keeps the safe-haven demand for gold price underpinned. Adding to the geopolitical tensions, soaring inflation and bargain hunting could be also associated with the renewed upswing in the bright metal.
Despite the risk-averse market conditions, the US dollar is losing ground so far this Friday, offering a helping hand to gold buyers. The freefall in the USD/JPY pair on higher Japanese inflation and verbal intervention is dragging the dollar broadly lower. The focus will continue to remain on risk trends, Ukraine updates and Fedspeak for fresh trading opportunities in gold price.
On Thursday, gold price finally broke the weekly consolidative mode to the upside, as surging oil prices accentuated fears over raging inflation and global economic growth, benefiting the inflation-hedge gold. Meanwhile, a stronger NATO response to the continued Russian hostilities in Ukraine kept risk trades shallow. Further, investors remained wary, as US President Joe Biden and European NATO counterparts prepare for the risk of Moscow launching a nuclear attack.
Markets weighed in the hawkish comments from Chicago Fed Chief Charles Evans against the Ukraine-led uncertainty and soaring inflation, scurrying for safety in gold price. Firmer yields and the US dollar also failed to deter gold bulls.
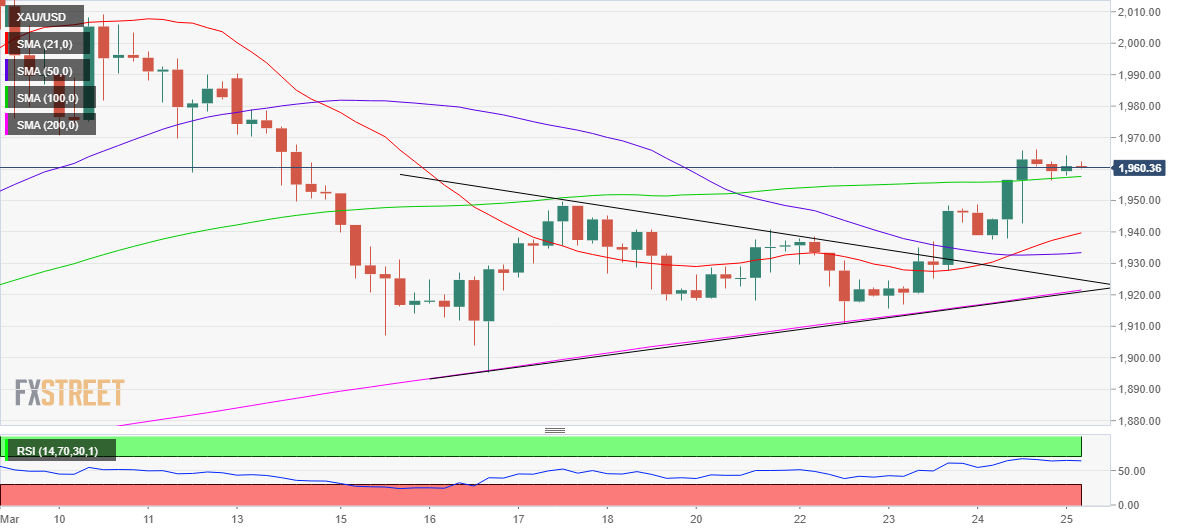
Gold: Four-hour chart
Gold price charted a classic symmetrical triangle upside break in the four-hour sticks early Thursday, prompting a fresh upswing in the yellow metal above $1,950.
The ongoing bullish momentum led gold price to recapture the ascending 100-Simple Moving Average (SMA), now at $1,957.
At the time of writing, gold price is trading around $1,960, up 0.18% on the day. Bulls are gathering pace before the next push higher.
The odds remain in favor of gold optimists, as the 14-day Relative Strength Index (RSI) inches higher towards the overbought territory while holding comfortably above the central line.
Buying resurgence could see the price resuming the uptrend towards the $1,970 round level, above which the February highs at $1,975 will lure buyers.
Bulls will then gear up for a test of the pattern target measured at $1,988.
On the downside, a firm break below the 100-SMA resistance now support will trigger a steep decline towards the upward-pointing 21-SMA at $1,939.
The next support of the 50-DMA awaits at $1,933, a breach of which will allow bears to flex their muscles towards the bullish 200-SMA at $1,923, where the triangle support coincides.
March 22 lows of $1,911 will be the level to beat for gold sellers.
Premium
You have reached your limit of 3 free articles for this month.
Start your subscription and get access to all our original articles.
Author

Dhwani Mehta
FXStreet
Residing in Mumbai (India), Dhwani is a Senior Analyst and Manager of the Asian session at FXStreet. She has over 10 years of experience in analyzing and covering the global financial markets, with specialization in Forex and commodities markets.


