Gold Price Forecast: XAU/USD gathers pace to test $1872 hurdle ahead of US CPI
- Gold probes the upside amid DXY and Treasury yields retreat.
- US stimulus hopes and covid woes underpin XAU/USD.
- Focus on US CPI and political drama amid a likely Trump impeachment

Gold (XAU/USD) extended the bounce from six-week lows on Tuesday, finishing the day with moderate gains well above the $1850 level. The recovery in the metal was enhanced by the retreat in the US dollar across the board, tracking the US Treasury pullback from 1-month highs. Markets assessed the demand for Treasuries amid expectations of a bigger fiscal stimulus under Biden’s presidency. Strong demand for the US bonds in the government auction on Tuesday also added to the downside in the yields. Meanwhile, a likely Trump’s impeachment also somewhat weighed down on the dollar.
Gold looks to build onto Tuesday’s rebound on Wednesday, with all eyes awaiting the US CPI report and the House vote on Trump’s removal from the Office after the deadly Capitol Hill attack. The greenback and the US rates continue their overnight weakness, which is likely to keep gold buoyed. Further, the US stimulus optimism and surging coronavirus cases in the US, Japan and China also boosts gold’s safe-haven appeal. However, the bounce in the global stocks amid a surge in oil prices and stimulus hopes could probably cap the gains in the precious metal. Markets will also pay close attention to the Fedspeak amid recent tapering talks.
Gold Price Chart - Technical outlook
Gold: Hourly chart
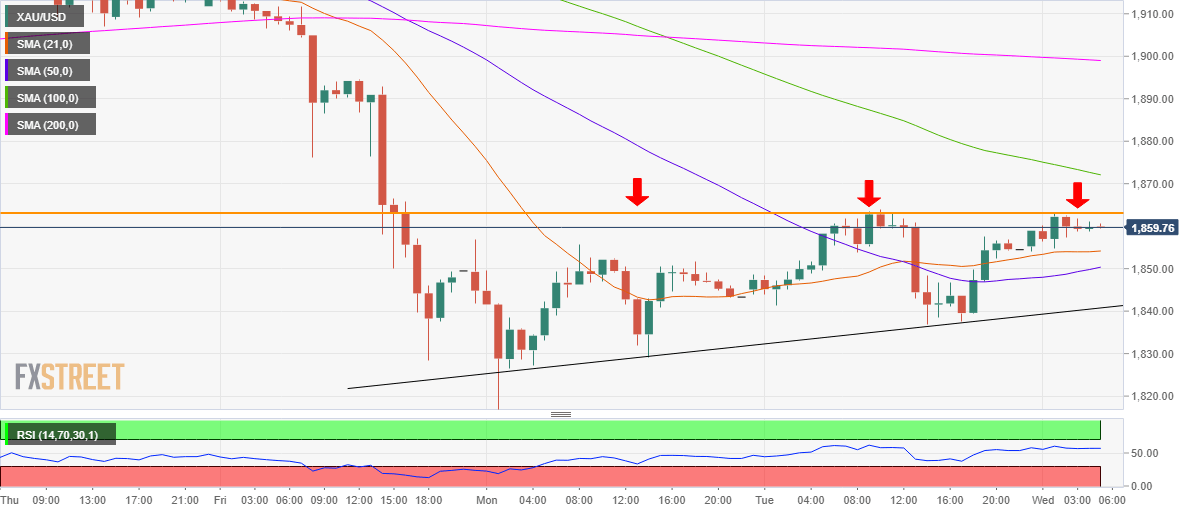
As observed in the hourly chart, the gold price is struggling to clear the critical horizontal resistance seen at $1863. Note that the recent sell-off followed by the recovery has charted an ascending triangle pattern on the said timeframe, with $1863 is the likely pattern resistance.
Acceptance above that level could validate the bullish pattern, calling for a test of the bearish 100-hourly moving average (HMA) at $1872. Buyers could then aim for the 200-HMA at $1899.
On the flip side, the 21-HMA at $1854 offers immediate support, below which the 50-HMA at $1850 could guard the downside. The pattern support at $1841 is likely to be tested if the selling pressure intensifies.
Premium
You have reached your limit of 3 free articles for this month.
Start your subscription and get access to all our original articles.
Author

Dhwani Mehta
FXStreet
Residing in Mumbai (India), Dhwani is a Senior Analyst and Manager of the Asian session at FXStreet. She has over 10 years of experience in analyzing and covering the global financial markets, with specialization in Forex and commodities markets.


