Gold Price Forecast: XAU/USD eyes $1,850 yet again amid a potential bear flag
- Gold Price looks south as a flight to safety remains the key theme.
- US dollar firms up global growth concerns, Treasury yields hold at the multi-year top.
- A potential bearish flag on gold’s 1D chart keeps XAU/USD’s downside favored.

The end of the week profit-taking on the US dollar longs, saved the day for Gold Price, as it settled Friday in the green at around $1,884 after witnessing good two-way businesses. The market continued to trade with caution on the final trading day of the week and following the release of the critical US Nonfarm Payrolls release. The headline US NFP steadied at 428K in April while beating estimates of a 391K print. The Unemployment Rate, however, increased slightly to 7%, matching expectations. The average hourly earnings growth slowed a bit, aligning with the less hawkish Fed stance. In response to the US jobs data, the dollar index slipped, allowing Gold Price to regain its recovery momentum towards $1,900. Although global growth worries kept the sentiment around the global stocks dour, underpinning the haven demand for the greenback.
Gold Price is back in the red zone on Monday after facing rejection below the $1,900-mark last Friday. The unrelenting strength in the US dollar alongside the Treasury yields, amid a risk-off market profile, weighs negatively on the bright metal. Investors remain concerned about the global growth prospects, in the face of the central banks’ tightening, China’s extended lockdowns and fresh G7 sanctions on Russian oil. So long as the Treasury yields hold near multi-year highs, the odds for a sustained Gold Price recovery remain weak. Looking forward, the US inflation and UK GDP data will be the main event risks for this week, which will have a significant bearing on the XAUUSD price action and the dollar valuations. In the meantime, the broader market sentiment amid intensifying growth concerns will likely lead the way.
It's worth noting that rising rates saw gold’s speculative net long fall by 16,507 lots, leaving speculators with a net long of 82,936 lots, according to the latest CFTC data.
Gold Price Chart: Daily chart
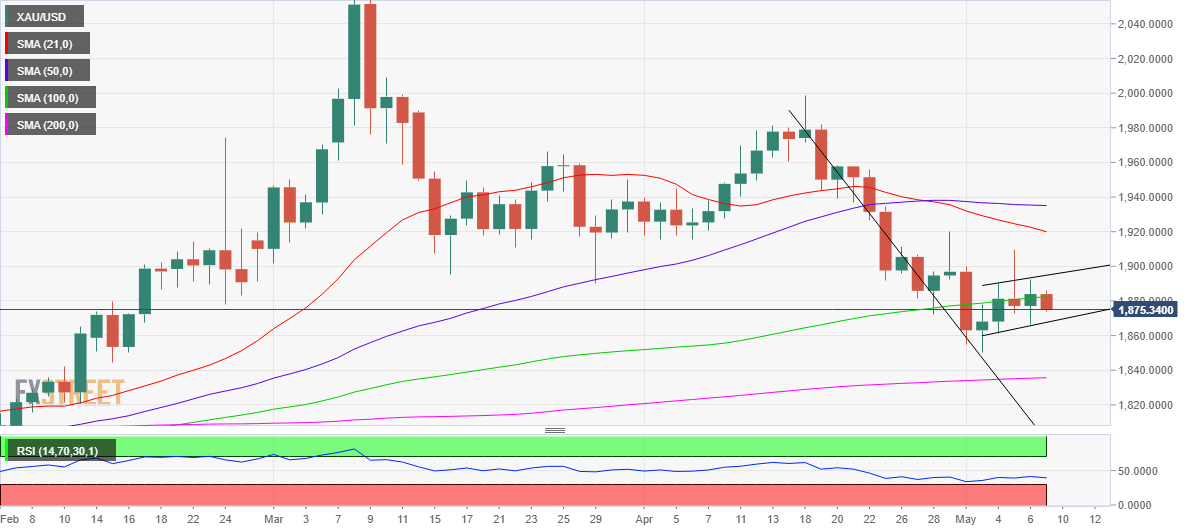
Despite Friday’s rebound, the path of least resistance for Gold Price remains down, given that the metal has carved out a bear flag on the daily chart.
Daily closing below the rising trendline support at $1,868 will confirm the bearish continuation formation, opening floors for a fresh sell-off towards the $1,850 psychological barrier.
The next key support awaits at $1,836, the horizontal 200-Daily Moving Average (DMA), below which a test of the $1,800 threshold will be inevitable.
The 14-day Relative Strength Index (RSI) is inching lower below the midline, suggesting that there is room for the additional downside.
On the flip side, acceptance above the rising trendline resistance at $1,895 on a daily closing basis is needed for any meaningful recovery in gold price. A sustained move above the latter will invalidate the bearish thesis for the time being.
Gold bulls will then look to retest the intermittent tops around the $1,910 region, above which the critical $1,920 hurdle will come into play. That level is the confluence of the bearish 21-DMA and April 29 highs.
Premium
You have reached your limit of 3 free articles for this month.
Start your subscription and get access to all our original articles.
Author

Dhwani Mehta
FXStreet
Residing in Mumbai (India), Dhwani is a Senior Analyst and Manager of the Asian session at FXStreet. She has over 10 years of experience in analyzing and covering the global financial markets, with specialization in Forex and commodities markets.


