Gold Price Forecast: XAU/USD extends its tepid recovery from weekly lows

XAU/USD Current price: $3,333.87
- An extended truce in the Middle East maintains financial markets optimistic.
- The United States will release the final estimate of the Q1 GDP on Thursday.
- XAU/USD holds on to familiar levels near weekly lows, resistance at $3,355.30.
Spot Gold spent Wednesday stuck around the $3,320 mark, with financial markets lacking a fresh catalyst. The XAU/USD managed to advance during the American session amid broad US Dollar weakness, but held within familiar levels ahead of the Asian opening.
Investors maintain their optimism as the Middle East ceasefire seems to be holding. Easing tensions, however, do not mean the conflict is over. According to some leaked documents, recent attacks on the Iranian nuclear program just delayed Iran’s plans by a few months. Israel, on the contrary, believes the setback reached many years.
United States (US) President Donald Trump, in the meantime, noted that the country’s nuclear capabilities have been “obliterated,” according to Reuters. At the same time, Tehran's atomic chief, Mohammad Eslami, said that they would restore their nuclear program.
Beyond geopolitical woes, market players eyed Federal Reserve (Fed) Chairman Jerome Powell's testimony on monetary policy. On his second day at Congress, Powell repeated most of what he said on Tuesday, noting that inflation expectations have come down a bit from April, although he is still willing to wait to see the impact of tariffs on prices before acting.
Thursday will bring some relevant US data, as the country releases May Durable Goods Orders and the final estimate of Q1 Gross Domestic Product (GDP).
XAU/USD short-term technical outlook
The daily chart for the XAU/USD pair shows it holds at the lower end of Tuesday’s range, although further retreating from its weekly low. The same chart shows technical indicators have turned flat within neutral levels, reflecting the latest bounce rather than suggesting additional gains ahead. The pair would face immediate resistance at around a flat 20 Simple Moving Average (SMA) currently at $3,355.30. Finally, the 100 and 200 SMAs maintain their firm bullish slopes well below the current level, keeping the long-term trend alive.
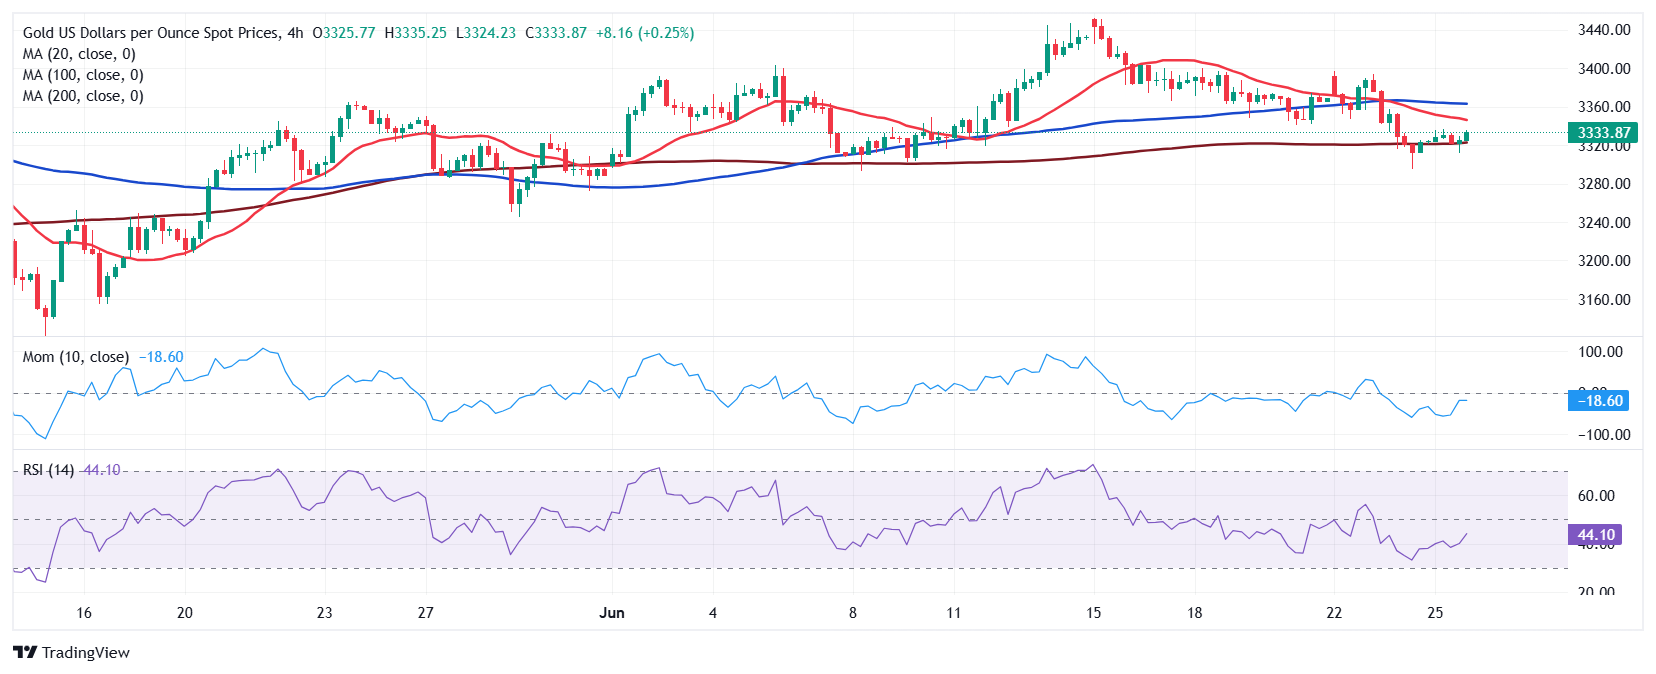
The 4-hour chart shows XAU/USD keeps finding near-term support at around a directionless 200 SMA, while the 20 and 100 SMAs maintain modest downward slopes above the current level. Technical indicators, in the meantime, have turned flat within negative levels after correcting oversold conditions, suggesting buyers have limited power at the time being.
Support levels: 3,311.90 3,295.45 3,279.20
Resistance levels: 3,355.30 3,374.45 3,389.40
Premium
You have reached your limit of 3 free articles for this month.
Start your subscription and get access to all our original articles.
Author

Valeria Bednarik
FXStreet
Valeria Bednarik was born and lives in Buenos Aires, Argentina. Her passion for math and numbers pushed her into studying economics in her younger years.


