Gold Price Forecast: XAU/USD extends its monthly slide towards $2,000

XAU/USD Current price: 2,015.77
- Federal Reserve’s speakers repeat the well-known message of wait and see.
- The United States will publish the January Consumer Price Index on Tuesday.
- XAU/USD nears the $2,000 mark with a solid bearish stance in the near term.
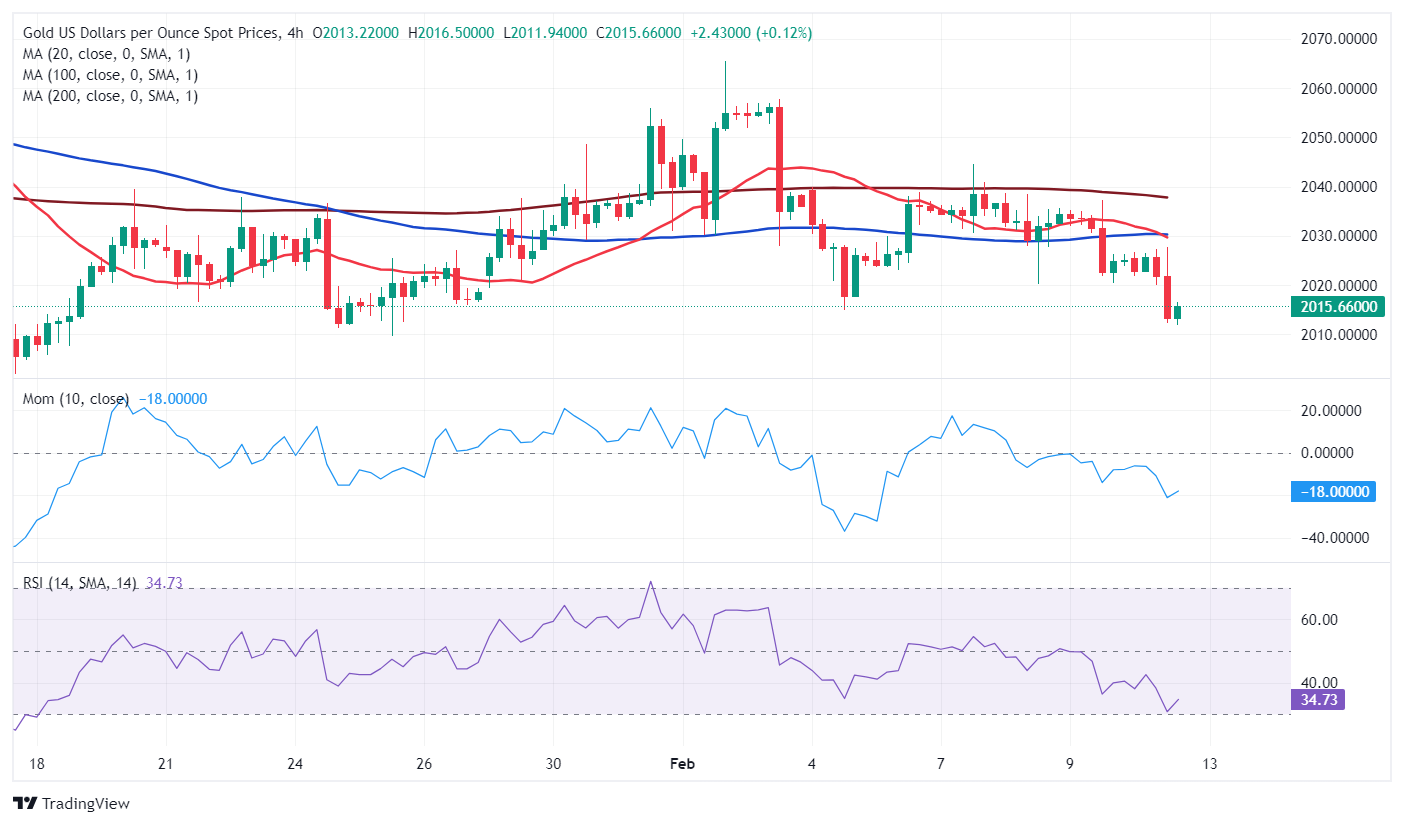
Gold eased throughout the first half of the day, finding some buyers ahead of Wall Street’s opening but resuming its slump afterwards. XAU/USD trades near a fresh February low of $2,011.97 despite subdued US Dollar demand.
In the absence of relevant macroeconomic data and ahead of first-tier figures scheduled for later in the week, the focus was on Federal Reserve (Fed) officials’ words. Board members have been downplaying the odds for a soon-to-come rate hike following the latest monetary policy meeting, generally pointing out that inflation still needs to come closer to their 2% goal and that they need more data before trimming rates.
Fed Board of Governors member Michelle Bowman was on the wires on Monday and repeated the current rate is in the rate place, adding it’s too soon “to predict” when rates will come down. Finally, she said that she doesn’t expect cuts to be appropriate in the immediate future. Thomas Barkin and Neel Kashkari will speak at different events throughout the American afternoon, but no surprises are expected from that side.
Meanwhile, the positive tone of equities weighs on the precious metal. US indexes trade in the green, with the S&P 500 extending gains beyond the 5,000 mark and reaching fresh record highs.
Market players are now waiting for a United States (US) inflation update. The country will release the January Consumer Price Index (CPI) on Tuesday, which is seen at 0.2% MoM and 3% YoY. The annual core reading is foreseen at 3.8%, slightly below the 3.9% posted in December. Softer-than-anticipated readings could revive hopes for soon-to-come rate cuts in the US.
XAU/USD short-term technical outlook
The daily chart for XAU/USD suggests it has more room to go. The pair met intraday sellers around a bearish 20 Simple Moving Average (SMA), currently at around $2,028. The longer moving averages remain far below the current level but have turned directionless. Finally, technical indicators gain downward traction, crossing their midlines into negative territory and reflecting increased selling interest.
In the near term, and according to the 4-hour chart, the bearish case is clearer. The XAU/USD pair develops below all its moving averages, and the 20 SMA gains is currently accelerating below a flat 100 SMA, both around $2,030. At the same time, technical indicators head firmly lower, approaching oversold readings but far from suggesting a potential downward exhaustion.
Support levels: 2,009.10 1,988.90 1,976.50
Resistance levels: 2,028.00 2,044.70 2,065.50
Author

Valeria Bednarik
FXStreet
Valeria Bednarik was born and lives in Buenos Aires, Argentina. Her passion for math and numbers pushed her into studying economics in her younger years.

















