Gold Price Forecast: XAU/USD extends its bearish route

XAU/USD Current price: $1,946.67
- Risk aversion continues to favor the Greenback as US lawmakers struggle to clinch a deal.
- The US Gross Domestic Product was upwardly revised in Q1 from 1.1% to 1.3%.
- XAU/USD remains at the lower end of its monthly range, with lower lows in sight.
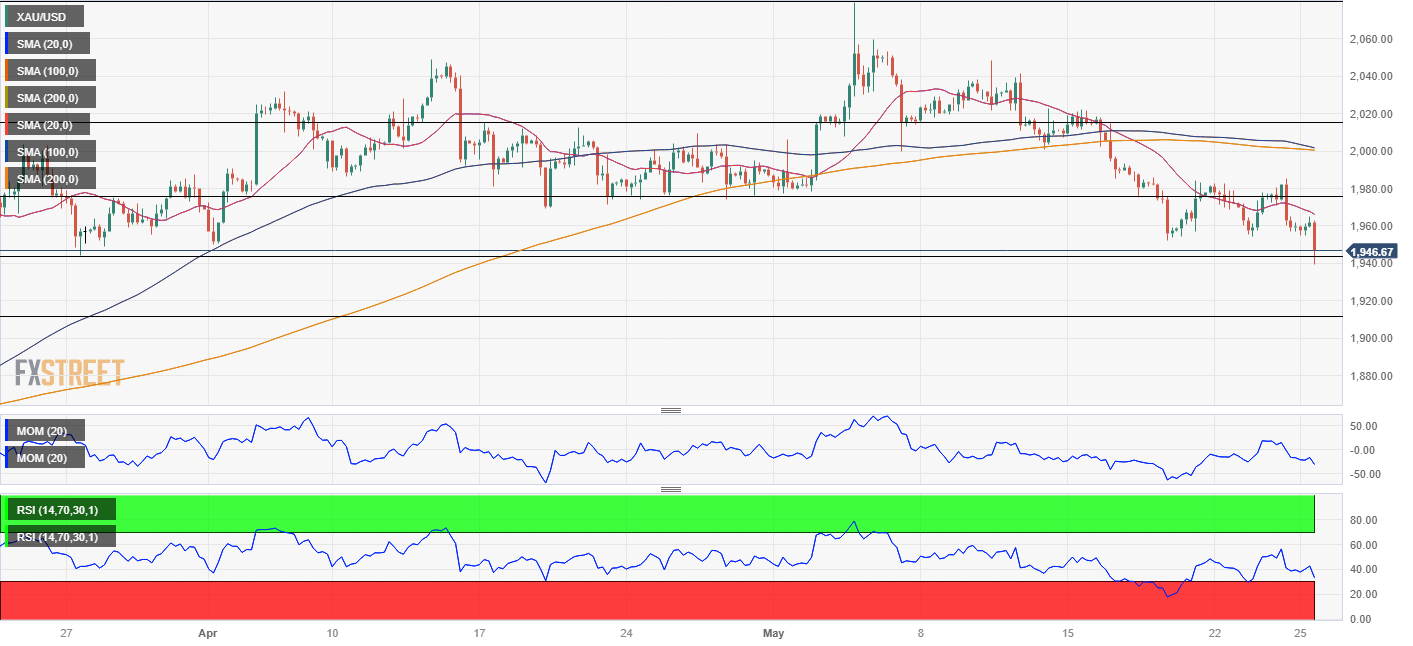
Gold has broken below the 50% retracement of the March/May rally at $1,943.86, bottoming during European trading hours at $1,930.20. XAU/USD bounced from the level but is struggling to recover above it.
The US Dollar continued to find support in a dismal market mood but also benefited from upbeat United States macroeconomic figures. The country upwardly revised its Q1 economic growth, and the annualized figure now stands at 1.3%, according to the Gross Domestic Product (GDP) report. On the one hand, the number suggests the country may avoid a recession, yet on the other, it opens the door for another round of rate hikes to tame inflation.
As a result, the American currency preserved its former strength, while stock markets held on the back foot amid concerns about the US debt-ceiling limit. President Joe Biden and top Republicans are engaged in negotiations in which the opposition demands spending cuts to agree on an extension of the debt ceiling. House Speaker Kevin McCarthy crossed the wires this Thursday, saying they have made some progress, although dismissing chances they could reach a deal today.
XAU/USD price short-term technical outlook
XAU/USD hovers around $1,945, down for a second consecutive day. Technical readings in the daily chart maintain the risk skewed to the downside, as the pair fell further below a now bearish 20 Simple Moving Average (SMA) while steadily approaching a directionless 100 SMA, currently providing dynamic support at around 1,933.70. At the same time, the Momentum indicator pared its decline but remains dip into the red, while the Relative Strength Index (RSI) indicator maintains its downward slope near 30, supporting another leg south.
The 4-hour chart shows that Gold develops below bearish moving averages, with the 20 SMA accelerating its decline and currently at around $1,965.20. Technical indicators have turned flat but remain well below their midlines without signs of changing course. The 61.8% retracement of the aforementioned rally stands at 1,911.97, a potential bearish target for the upcoming sessions.
Support levels: 1,933.70 1,912.00 1,901.80
Resistance levels: 1,954.90 1,965.20 1,972.00
Premium
You have reached your limit of 3 free articles for this month.
Start your subscription and get access to all our original articles.
Author

Valeria Bednarik
FXStreet
Valeria Bednarik was born and lives in Buenos Aires, Argentina. Her passion for math and numbers pushed her into studying economics in her younger years.


