Gold Price Forecast: XAU/USD down but not out amid triangle breakout, dovish Fed bets
- Gold price trades close to record highs near $2,500 early Monday.
- The US Dollar sees fresh selling amid risk appetite, sluggish US Treasury bond yields.
- Dovish Fed bets heighten ahead of Chair Jerome Powell’s speech and FOMC Minutes.
- Gold price charted a symmetrical triangle breakout on Friday, with upside bias still intact.

Gold price is battling $2,500 early Monday, having refreshed all-time highs at $2,510. Gold traders prefer to take profits off the table, repositioning before the key US Federal Reserve (Fed) Minutes of the July meeting and Chairman Jereme Powell’s speech later this week.
Gold price eases, but bullish bias still intact
Gold price witnessed a steep rise during the second half of Friday’s trading, gaining as much as 3% on the week.
The Gold price rally was mainly backed by heightened expectations of a Fed rate cut in September, as traders turned their attention to the upcoming week’s Jackson Hole Symposium, where Fed Chair Jerome Powell could throw fresh hints on additional easing beyond September.
Dovish comments from Chicago Fed President Austan Goolsbee warned that officials should be wary of keeping the restrictive policy in place longer than necessary.
In light of the dovish Fed expectations, Gold price rallied to a fresh record high of $2,509 on Friday, further supported by rife tensions in the Middle East. An imminent Iranian attack on Israel loomed, as Hamas mulled over ceasefire talks with the latter.
In Monday’s trading so far, Gold buyers appear to have taken a breather, consolidating Friday’s upsurge while finding fresh haven demand after Hamas rejected the latest US proposal for Gaza hostage and ceasefire deal on Sunday. Iran-backed militant group, Hamas, blamed Israeli Prime Minister Benjamin Netanyahu for putting up new obstacles in the talks, as cited by The Times of Israel.
Amidst renewed geopolitical tensions, the Gold price retracement remains limited, also as technical indicators on the daily time frame indicate more upside is likely in the near term.
Gold price technical analysis: Daily chart
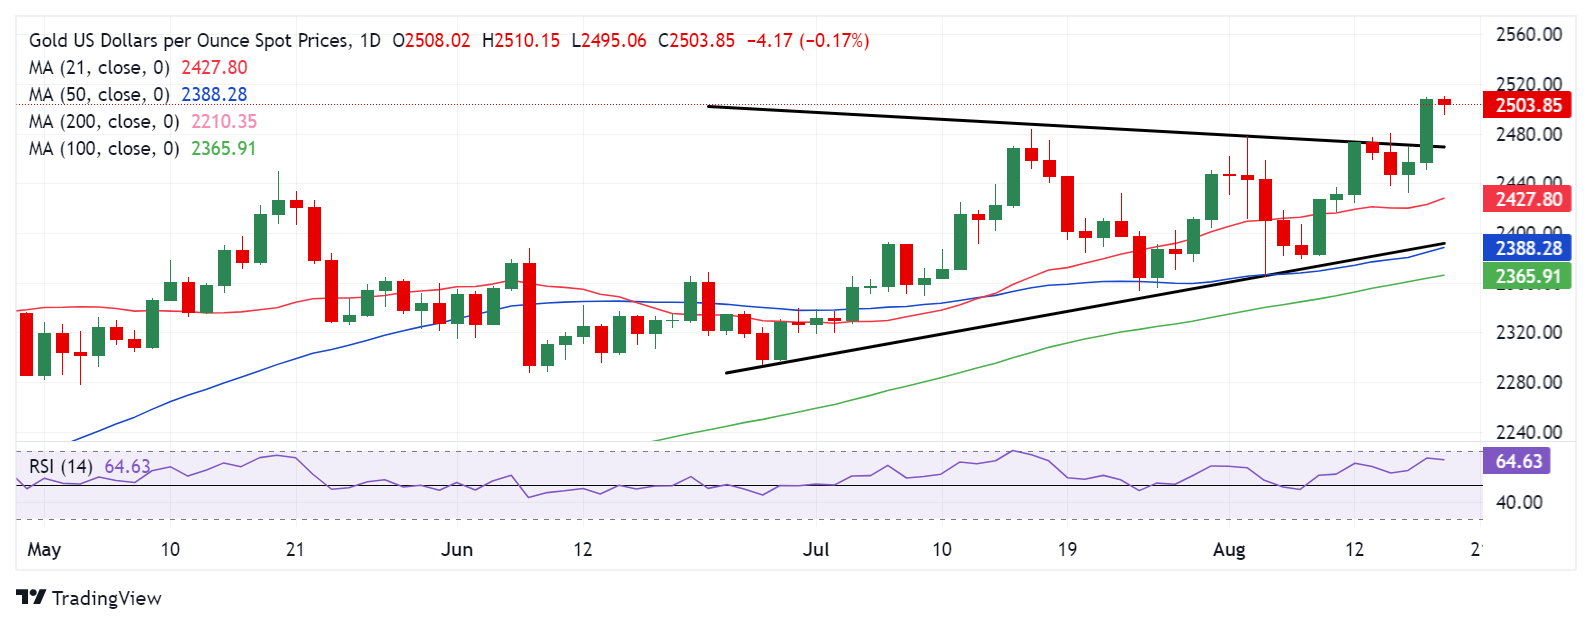
Gold price closed Friday above the upper boundary of a symmetrical triangle formation, then at $2,470, confirming an upside break of the symmetrical triangle formation.
The 14-day Relative Strength Index (RSI) is easing off higher levels but remains well above the 50 level, suggesting that Gold price remains a ‘buy-the-dip’ trade.
If the new record high of $2,510 is reclaimed on a sustained basis, the next relevant topside target is seen at the $2,550 level. Acceptance above the latter could challenge the $2,600 round level en route to the triangle target, measured at $2,660.
In case the Gold price pullback gathers traction, the immediate support is seen around the previous $2,480 static supply zone, below which the triangle resistance-turned-support, now at $2,467 will be tested.
Further south, the $2,450 support will come into play.
(This story was corrected on August 19 at 06:15 GMT to say that the $2,480 static supply zone is a support, not a resistance.)
Gold FAQs
Gold has played a key role in human’s history as it has been widely used as a store of value and medium of exchange. Currently, apart from its shine and usage for jewelry, the precious metal is widely seen as a safe-haven asset, meaning that it is considered a good investment during turbulent times. Gold is also widely seen as a hedge against inflation and against depreciating currencies as it doesn’t rely on any specific issuer or government.
Central banks are the biggest Gold holders. In their aim to support their currencies in turbulent times, central banks tend to diversify their reserves and buy Gold to improve the perceived strength of the economy and the currency. High Gold reserves can be a source of trust for a country’s solvency. Central banks added 1,136 tonnes of Gold worth around $70 billion to their reserves in 2022, according to data from the World Gold Council. This is the highest yearly purchase since records began. Central banks from emerging economies such as China, India and Turkey are quickly increasing their Gold reserves.
Gold has an inverse correlation with the US Dollar and US Treasuries, which are both major reserve and safe-haven assets. When the Dollar depreciates, Gold tends to rise, enabling investors and central banks to diversify their assets in turbulent times. Gold is also inversely correlated with risk assets. A rally in the stock market tends to weaken Gold price, while sell-offs in riskier markets tend to favor the precious metal.
The price can move due to a wide range of factors. Geopolitical instability or fears of a deep recession can quickly make Gold price escalate due to its safe-haven status. As a yield-less asset, Gold tends to rise with lower interest rates, while higher cost of money usually weighs down on the yellow metal. Still, most moves depend on how the US Dollar (USD) behaves as the asset is priced in dollars (XAU/USD). A strong Dollar tends to keep the price of Gold controlled, whereas a weaker Dollar is likely to push Gold prices up.
Author

Dhwani Mehta
FXStreet
Residing in Mumbai (India), Dhwani is a Senior Analyst and Manager of the Asian session at FXStreet. She has over 10 years of experience in analyzing and covering the global financial markets, with specialization in Forex and commodities markets.