Gold Price Forecast: XAU/USD defends 50-day SMA ahead of US PPI inflation data
- Gold price attempts a tepid bounce early Wednesday as focus shifts to trade updates and US PPI data.
- The US Dollar retreats alongside Treasury bond yields even as risk-off flows persist.
- Gold price needs to crack the 50-day SMA support at $3,323; daily RSI reclaims midline.

Gold price is replicating the tepid recovery moves seen in the first half of Tuesday’s trading as buyers try their luck the third time early Wednesday, heading into the US Producer Price Index (PPI) inflation test.
Gold price susceptible to potential US Dollar resurgence
Despite the latest uptick, Gold price appears to lack bullish conviction as the US Dollar (USD) remains in an upside consolidative mode against its major currency rivals, having risen for the seventh consecutive day on Tuesday.
The USD resumed its uptrend, capitalizing on the rally in the 10-year benchmark US Treasury bond yields after the US Consumer Price Index (CPI) accelerated in June, moving away from the Federal Reserve’s (Fed) 2% inflation target.
The June CPI increased 0.3% on the month, driving the 12-month inflation rate to 2.7%, in line with expectations. The core figures also rose 0.2% over the month and 2.9% annually, but undermined estimates.
The uptick in US inflation bolstered bets for an extended pause by the Fed for a longer period than initially expected, with the odds of a September Fed rate cut falling to about 52% from nearly 60% pre-data release, per the CME Group’s FedWatch Tool.
Hawkish Fed expectations combined with US President Donald Trump’s announcement of a trade deal with Indonesia helped the USD keep the upper hand, fuelling a fresh decline in the non-interest-bearing Gold price.
The US yields and the USD also tracked the advance in the Japanese government bond yields and the USD/JPY pair as the Asian nation’s bond market and the local currency suffered extensively on heightening fiscal and political concerns.
Citing a story from Asahi newspaper, Reuters reported that “Japan's ruling coalition will likely lose its majority in the upper house election on July 20, heightening the risk of political instability at a time the country struggles to strike a trade deal with the US.”
However, America’s artificial intelligence (AI) pioneer’s, Nvidia, headlines-driven tech rally curbed the USD uptrend, offering some support to the bright metal.
In Wednesday’s trading so far, uncertainty over Trump’s trade policy and Jerome Powell’s tenure as a Fed Chairman act as headwind to the Greenback, allowing Gold price to come up for some air.
Looking ahead, it remains to be seen if Gold price can sustain the bounce as traders refrain from creating fresh positions ahead of the US PPI data.
If the June US PPI comes in hotter than the expected 2.5% print over the year, while the monthly PPI also above 0.2% forecast, a fresh leg higher in the USD cannot be ruled out at the expense of Gold price.
Meanwhile, developments on the trade front will continue to play a pivotal role in driving risk sentiment, especially after Trump announced late Tuesday that he will send letters notifying smaller countries of their US tariff rates, per Reuters.
Gold price technical analysis: Daily chart
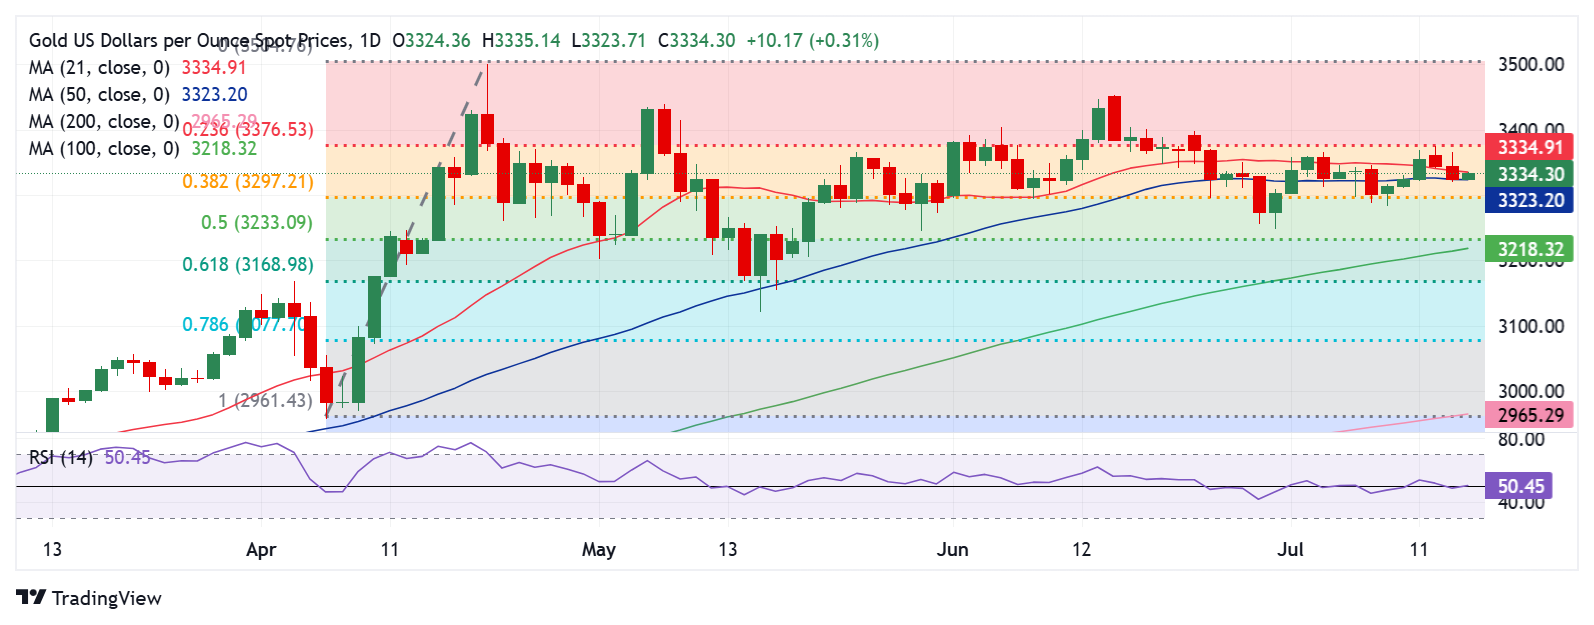
As observed on the daily chart, Gold price is stuck between two key barriers, with the 21-day Simple Moving Average (SMA) support-turned-resistance at $3,335 checking the upside.
On the other hand, the 50-day SMA at $3,323 cushions the downside.
The 14-day Relative Strength Index (RSI) is sitting just above the midline, currently near 50.50, suggesting that buyers could retain control.
Acceptance above the 21-day SMA is critical to sustaining the renewed upside, above which the 23.6% Fibonacci Retracement (Fibo) level of the April record rally at $3377 will be put to the test once again.
Further north, the $3,400 round level will challenge bearish commitments.
In contrast, rejection at the 21-day SMA could attack the 50-day SMA support.
Sellers must find a strong foothold below the 50-day SMA on daily closing basis.
The next healthy support levels are located at the 38.2% Fibo level of the same rally at $3,297 and the July low of $3,283.
Gold FAQs
Gold has played a key role in human’s history as it has been widely used as a store of value and medium of exchange. Currently, apart from its shine and usage for jewelry, the precious metal is widely seen as a safe-haven asset, meaning that it is considered a good investment during turbulent times. Gold is also widely seen as a hedge against inflation and against depreciating currencies as it doesn’t rely on any specific issuer or government.
Central banks are the biggest Gold holders. In their aim to support their currencies in turbulent times, central banks tend to diversify their reserves and buy Gold to improve the perceived strength of the economy and the currency. High Gold reserves can be a source of trust for a country’s solvency. Central banks added 1,136 tonnes of Gold worth around $70 billion to their reserves in 2022, according to data from the World Gold Council. This is the highest yearly purchase since records began. Central banks from emerging economies such as China, India and Turkey are quickly increasing their Gold reserves.
Gold has an inverse correlation with the US Dollar and US Treasuries, which are both major reserve and safe-haven assets. When the Dollar depreciates, Gold tends to rise, enabling investors and central banks to diversify their assets in turbulent times. Gold is also inversely correlated with risk assets. A rally in the stock market tends to weaken Gold price, while sell-offs in riskier markets tend to favor the precious metal.
The price can move due to a wide range of factors. Geopolitical instability or fears of a deep recession can quickly make Gold price escalate due to its safe-haven status. As a yield-less asset, Gold tends to rise with lower interest rates, while higher cost of money usually weighs down on the yellow metal. Still, most moves depend on how the US Dollar (USD) behaves as the asset is priced in dollars (XAU/USD). A strong Dollar tends to keep the price of Gold controlled, whereas a weaker Dollar is likely to push Gold prices up.
Premium
You have reached your limit of 3 free articles for this month.
Start your subscription and get access to all our original articles.
Author

Dhwani Mehta
FXStreet
Residing in Mumbai (India), Dhwani is a Senior Analyst and Manager of the Asian session at FXStreet. She has over 10 years of experience in analyzing and covering the global financial markets, with specialization in Forex and commodities markets.


