Gold Price Forecast: XAU/USD defends 21-day SMA amid renewed geopolitical, trade tensions
- Gold battles $4,100, reversing the Asian dip to near $4,065 on Thursday.
- US Dollar finds fresh haven bids as geopolitics and trade headlines dent risk appetite.
- Gold buyers stay hopeful whilst above the 21-day SMA at $4,024, with daily RSI still bullish.

Gold has reversed the early Asian dip to near $4,065 on Thursday, battling the $4,100 mark as traders look for fresh developments on the geopolitical and trade front.
Gold supported amid safe-haven flows
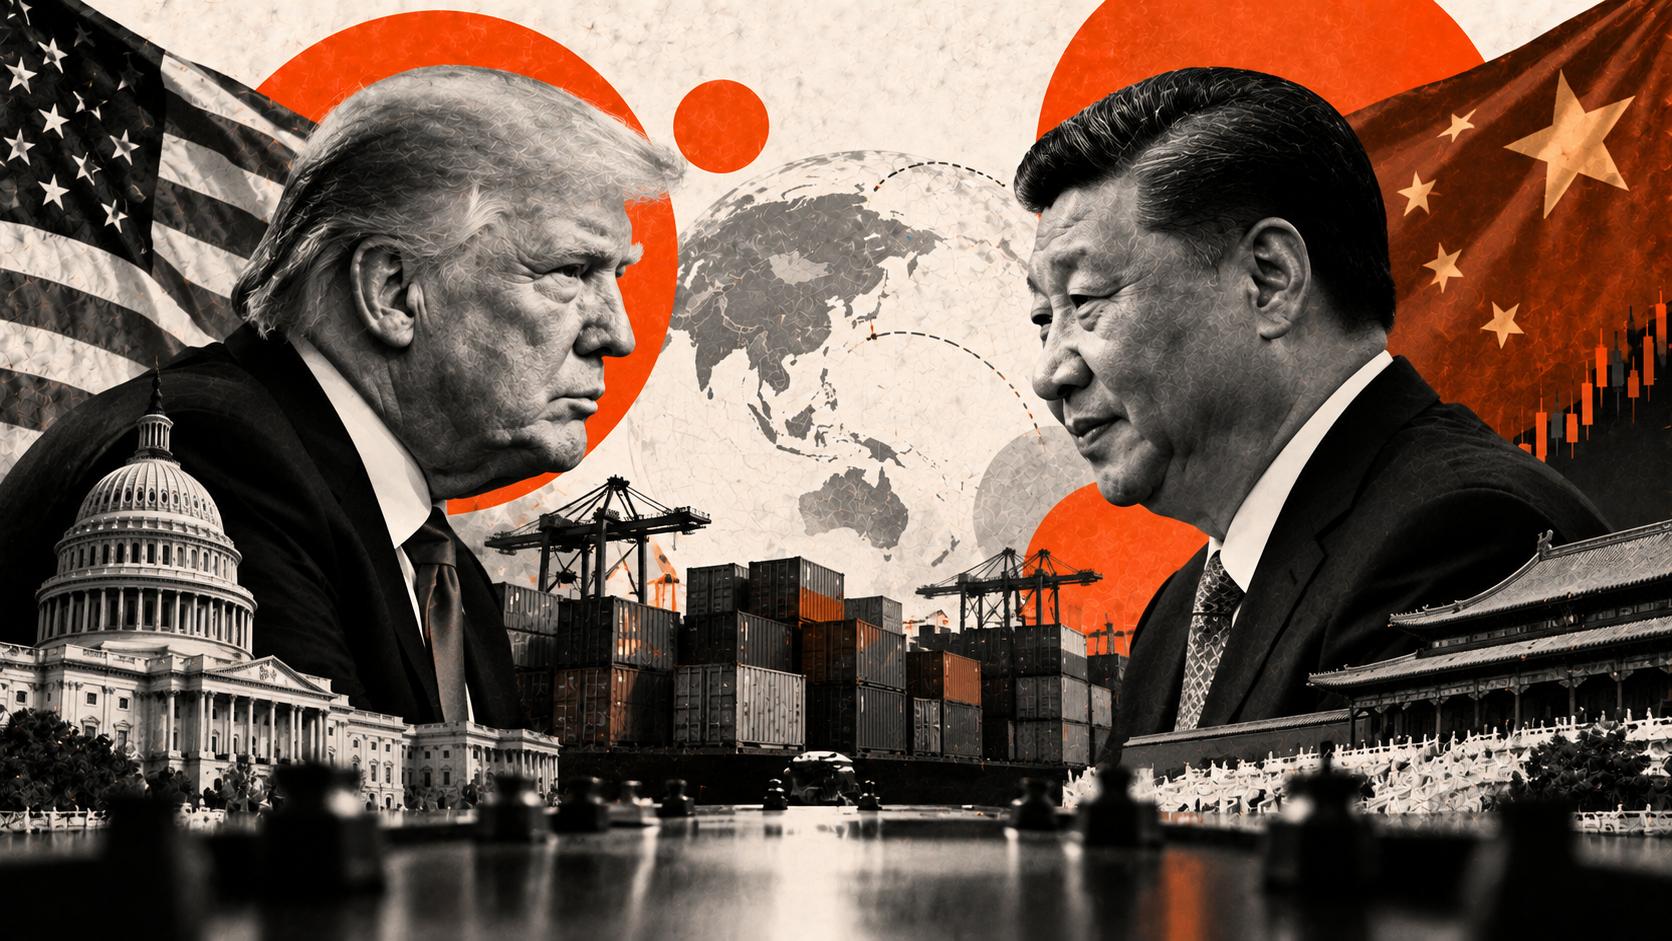
Risk-off flows extended into early Thursday as markets reacted negatively to reports of fresh US threats on Chinese products.
Reuters reported that the US is considering a plan to restrict an array of software-powered exports to China, from laptops to jet engines, to retaliate against Beijing's latest round of rare earth export restrictions.
Meanwhile, renewed geopolitical headlines also hogged the limelight after US President Donald Trump imposed sanctions on Russia's major oil companies and accused the Russians of a lack of commitment toward ending the war in Ukraine.
Markets also weighed the disappointing earnings reports from US tech giants. Tesla reported below forecast profits, while Netflix tumbled on grim outlook.
“Apple shares fell 1.6% after the tech giant was hit with a complaint to EU antitrust regulators by two civil rights groups on Wednesday,” per Reuters.
These factors overshadow any optimism over a likely US-China trade deal next week, as hinted by US President Donald Trump.
Broad risk aversion helps the US Dollar (USD) regain its safe-haven status, limiting Gold’s recovery momentum. The recent decline in the Pound Sterling (GBP) and the Japanese Yen (JPY) also keeps the sentiment around the Greenback underpinned.
Looking ahead, it remains to be seen if Gold can sustain its recovery, despite the USD’s dominance. This depends on the incoming geopolitical and trade updates in the absence of the US economic data releases.
All eyes turn to Friday’s US Consumer Price Index (CPI) data, but an interest rate cut by the Federal Reserve next week is fully priced in. However, traders could continue taking profits on their Gold longs in the lead-up to the US CPI event risk.
Gold price technical analysis: Daily chart
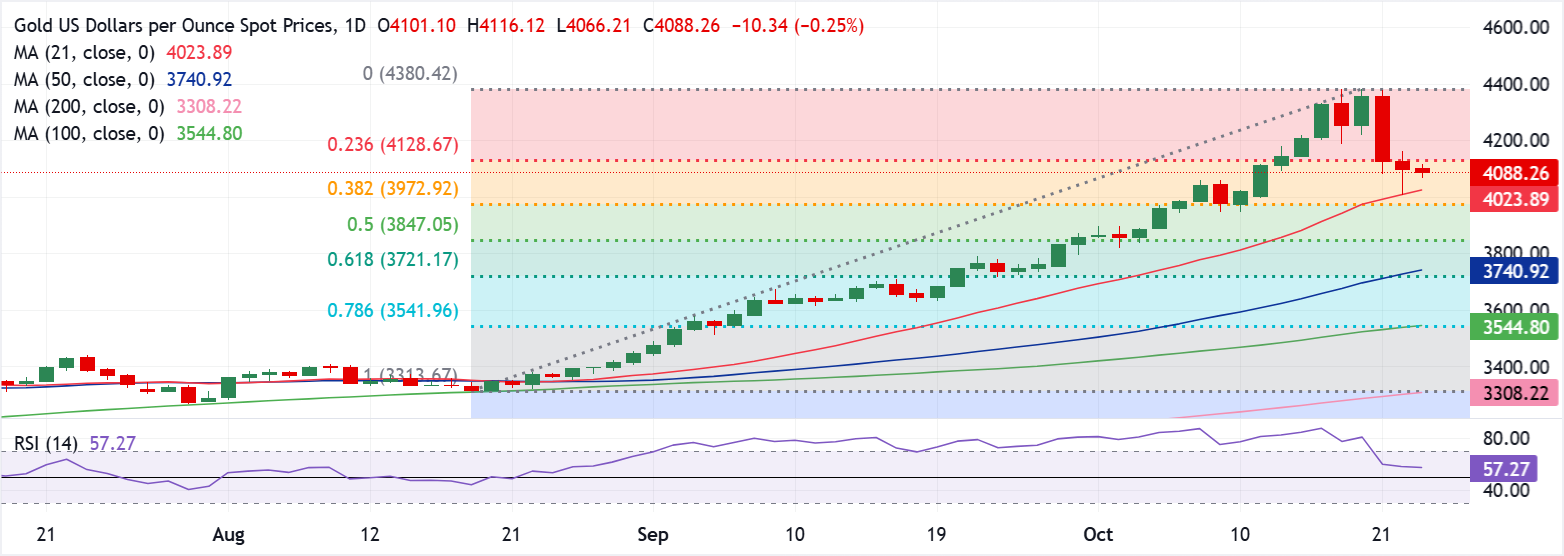
Gold continues to defend the 21-day Simple Moving Average (SMA), now at $4,024.
Meanwhile, the 14-day Relative Strength Index (RSI) looks to turn around, currently near 57.
The leading indicator suggests that Gold buyers could likely regain control in the near term.
However, they must recapture the 23.6% Fibonacci Retracement (August 19 low to October 20 high) support-turned-resistance at $4,129 to revive the record-setting rally.
The next topside hurdle is seen at the $4,300 round level, followed by the all-time highs of $4,382.
On the flip side, if the 21-day SMA is breached on a daily candlestick closing basis, the 38.2% Fibo level at $3,972 could lend immediate support.
A steeper correction could unfold on a failure to resist above the latter, opening doors toward the 50% Fibo level at $3,847.
US-China Trade War FAQs
Generally speaking, a trade war is an economic conflict between two or more countries due to extreme protectionism on one end. It implies the creation of trade barriers, such as tariffs, which result in counter-barriers, escalating import costs, and hence the cost of living.
An economic conflict between the United States (US) and China began early in 2018, when President Donald Trump set trade barriers on China, claiming unfair commercial practices and intellectual property theft from the Asian giant. China took retaliatory action, imposing tariffs on multiple US goods, such as automobiles and soybeans. Tensions escalated until the two countries signed the US-China Phase One trade deal in January 2020. The agreement required structural reforms and other changes to China’s economic and trade regime and pretended to restore stability and trust between the two nations. However, the Coronavirus pandemic took the focus out of the conflict. Yet, it is worth mentioning that President Joe Biden, who took office after Trump, kept tariffs in place and even added some additional levies.
The return of Donald Trump to the White House as the 47th US President has sparked a fresh wave of tensions between the two countries. During the 2024 election campaign, Trump pledged to impose 60% tariffs on China once he returned to office, which he did on January 20, 2025. With Trump back, the US-China trade war is meant to resume where it was left, with tit-for-tat policies affecting the global economic landscape amid disruptions in global supply chains, resulting in a reduction in spending, particularly investment, and directly feeding into the Consumer Price Index inflation.
Author

Dhwani Mehta
FXStreet
Residing in Mumbai (India), Dhwani is a Senior Analyst and Manager of the Asian session at FXStreet. She has over 10 years of experience in analyzing and covering the global financial markets, with specialization in Forex and commodities markets.