Gold Price Forecast: XAU/USD could recapture $1,800 amid symmetrical triangle breakout
- Gold is breaking higher despite the bounce in the DXY and Treasury yields.
- Markets will take cues from Omicron updates, risk trends ahead of the Fed.
- Gold price confirms a symmetrical triangle breakout on the 4H chart.

Gold price found support once again at the $1,770 level on Friday, as a robust recovery ensured to $1,790, in the wake of the expected jump in the US inflation. The US Consumer Price Index (CPI) rose by 6.8% YoY in November, matching the consensus forecast while weighing on the prospects of aggressive Fed’s tightening next year. Against this backdrop, the US Treasury yields fell across the curve, lifting the non-yielding gold price at the dollar’s expense. Additionally, markets were less worried over the likely negative impact of the Omicron covid variant on the global economic recovery, which translated into another record rally in Wall Street indices. The market’s optimism exerted additional bearish pressure on the greenback, aiding gold’s turnaround from five-day troughs.
After a tense start to the week, the risk sentiment is a touch better so far this Monday, as China’s stimulus expectations outweighed the concerns over the Omicron variant-led risks faced by the UK. The reduced demand for safe-haven assets such as the US Treasuries has triggered a bounce in the yields, in turn, prompting a rebound in the greenback as well. Therefore, the renewed upside in gold price remains restricted, with investors awaiting Wednesday’s Fed decision to place any directional bets. The Fed is likely to announce faster tapering from January 2022 while the Dot plot graph could hint at a mid-2022 rate lift-off. Although amid looming uncertainty over the new variant, investors could see a dovish tapering announcement, calling for an extension of the recent recovery in gold price.
Gold Price Chart - Technical outlook
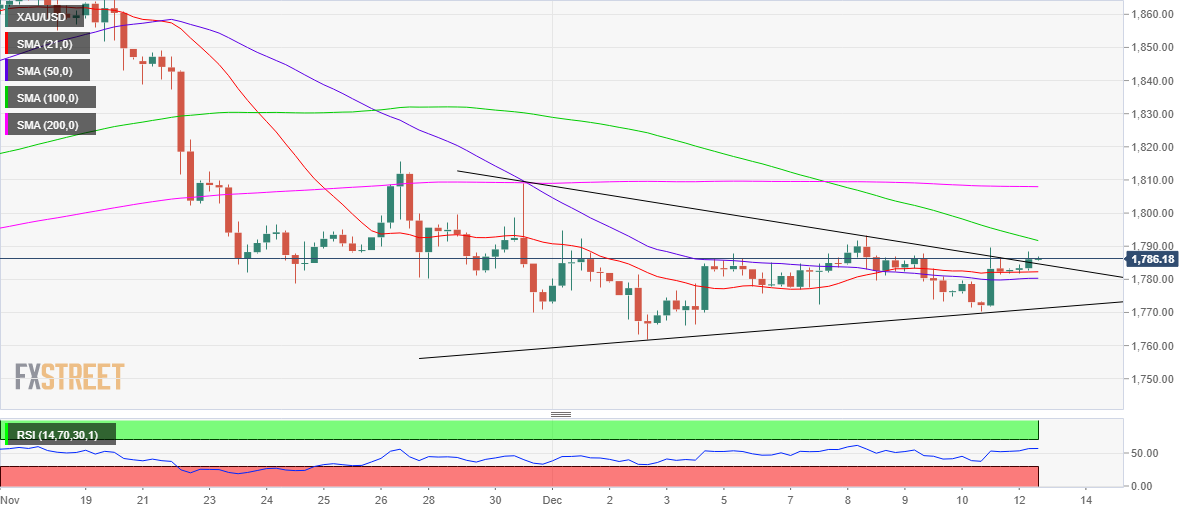
Gold: Four-hour chart
Gold price has confirmed a two-week-long symmetrical triangle breakout on the four-hour chart, earlier on, following a sustained closing above the falling trendline resistance at $1,785.
The upside breakout clears the path for a test of the downward-sloping 100-Simple Moving Average (SMA) at $1,792.
Acceptance above the latter will bring the $1,800 threshold back into the picture, above which a fresh upswing towards the horizontal 200-SMA at $1,808 is envisioned.
The Relative Strength Index (RSI) looks north above the midline on the said time frame, backing the bullish potential.
On the flip side, any reversal from higher levels will challenge the $1,782 support area, which is where the 21 and 50-SMAs close in.
A decisive break below the latter could trigger a steep drop towards the triangle support at $1,771.
The next relevant support is seen at the fierce cap of around $1,761.
Premium
You have reached your limit of 3 free articles for this month.
Start your subscription and get access to all our original articles.
Author

Dhwani Mehta
FXStreet
Residing in Mumbai (India), Dhwani is a Senior Analyst and Manager of the Asian session at FXStreet. She has over 10 years of experience in analyzing and covering the global financial markets, with specialization in Forex and commodities markets.


