Gold Price Forecast: XAU/USD corrects lower, holds above the weekly low

XAU/USD Current price: $3,645.43
- Better-than-anticipated United States macroeconomic data backed the US Dollar.
- US indexes remain in the green after Fed’s decision, DJIA reaches record highs.
- XAU/USD corrects overbought conditions, additional slides likely if $3,626 gives up.
Spot Gold extends its slide on Thursday, bottoming during American trading hours at $3,627.98. The US Dollar (USD) gathered near-term momentum following the release of encouraging United States (US) data.
The country reported that Initial Jobless Claims for the week ended September 13 rose by 231K, better than the 240K anticipated and easing from the previous 264K. Additionally, the Philadelphia Fed Manufacturing Survey surged to 23.2 from the previous -0.3 while largely surpassing the expected 2.3.
Other than that, Gold eases on the back of increased demand for high-yielding assets. Wall Street trades in the green, with the Dow Jones Industrial Average (DJIA) reaching fresh record highs in pre-opening trading. American indexes advance on the back of the Federal Reserve (Fed) decision to cut interest rates following its September meeting.
Officials suggested similar cuts will come in October and December, as the dot-plot showed two more rate cuts in the docket for 2025, and one more for 2026. As a result, equities surged on the back of easing borrowing costs.
Meanwhile, the Bank of England (BoE) decided to keep its benchmark rate on hold at 4% early Thursday, as widely anticipated. Policymakers voted 7-2 to keep rates on hold, also meeting expectations. The event, which included no fresh forecast or a press conference, had no impact on financial markets.
The central banks’ week will end with the Bank of Japan (BoJ) announcing its decision on monetary policy early on Friday. The central bank is expected to hold its fire this time and keep interest rates at 0.5%, but rate hikes are in the docket for future meetings amid hawkish comments from BoJ officials.
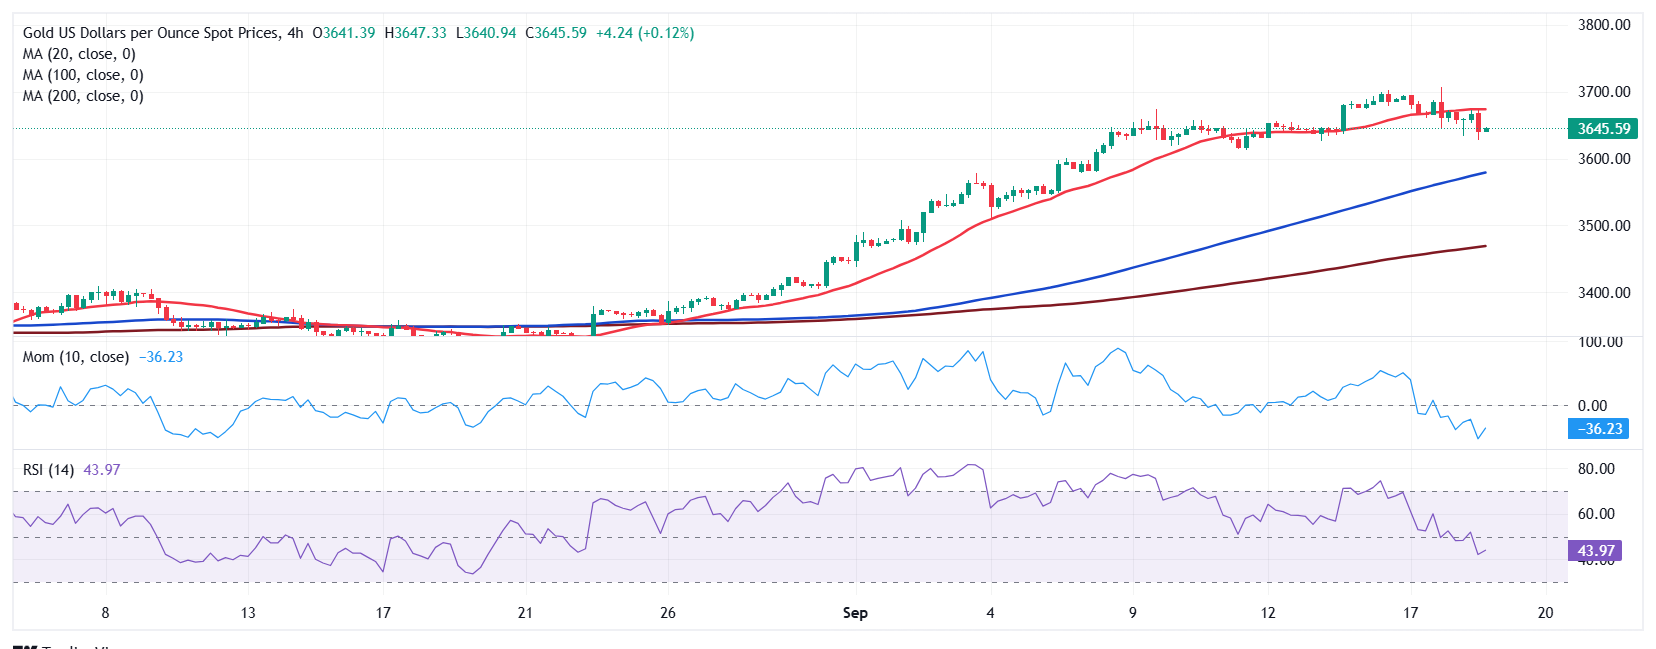
XAU/USD short-term technical outlook
The daily chart for the XAU/USD pair shows it is down for a second consecutive day, hovering in the $3,640 region. The decline is modest and seems corrective in the medium term, as technical indicators in the mentioned time frame eased from their extreme peaks but remain close to overbought readings. At the same time, the pair develops far above all its moving averages, with the 20 Simple Moving Average (SMA) heading firmly north at around $3,547, in line with the dominant bullish trend. The weekly low at $3,626.66 is the immediate support level, with a clear downward extension below it, opening the door for additional slides.
The near-term picture for the bright metal is bearish. The 4-hour chart shows that a mildly bullish 20 SMA cap advances, currently at around $3,675.00, while the Momentum indicator heads south almost vertically, well below its 100 line. The Relative Strength Index (RSI) indicator also aims lower within negative levels at around 43, supportive on another leg south. Finally, the 100 and 200 SMAs maintain their bullish slopes far below the current level, confirming the slide remains corrective and there’s a long way to go before Gold changes course.
Support levels: 3,626.70 3,611.70 3,600.00
Resistance levels: 3,655.90 3,675.00 3,693.40
Author

Valeria Bednarik
FXStreet
Valeria Bednarik was born and lives in Buenos Aires, Argentina. Her passion for math and numbers pushed her into studying economics in her younger years.


