Gold Price Forecast: XAU/USD corrects from record highs, battles $3,740

XAU/USD Current price: $3,742.20
- Comments from Fed Chair Jerome Powell helped the US Dollar trim part of its losses.
- The United States will release the final estimate of the Q2 Gross Domestic Product on Thursday.
- XAU/USD near-term corrective slide set to continue one below $3,736.00.
Gold prices retreated from record highs on Wednesday, now changing hands near an intraday low of $3,749.63. The US Dollar (USD) found near-term demand as Federal Reserve (Fed) Chair Jerome Powell commented on monetary policy on Tuesday. His words had no immediate impact on financial markets, but as investors digested the news, a less dovish monetary policy future for the United States (US) surged.
Chair Powell pretty much reiterated what he said following the September monetary policy announcement, sticking to a cautious approach to future interest rate cuts amid risks of inflation gaining fresh momentum. On the labor market, Powell noted it is less dynamic and "somewhat softer," but did not sound concerned. These comments followed a row of Fed speakers pledging more aggressive action. As a result, the Greenback recovered on relief.
Focus now shifts to the upcoming US data. The country will release the final estimate of the Q2 Gross Domestic Product (GDP) on Thursday and updated Personal Consumption Expenditures (PCE) Price Index figures on Friday. Stable growth and easing inflationary pressures would provide additional strength to the Greenback.
XAU/USD short-term technical outlook
The daily chart for the XAU/USD pair shows it trimmed Tuesday's gains, but also that it holds at the upper end of its weekly range. In the same chart, technical indicators eased, but remain far above their midlines. In fact, the Relative Strength Index heads marginally lower at around 74, still in extreme readings. At the same time, the pair keeps developing above bullish moving averages, with the 20 Simple Moving Average (SMA) heading firmly south at around $3,617, reflecting the bulls’ dominance.
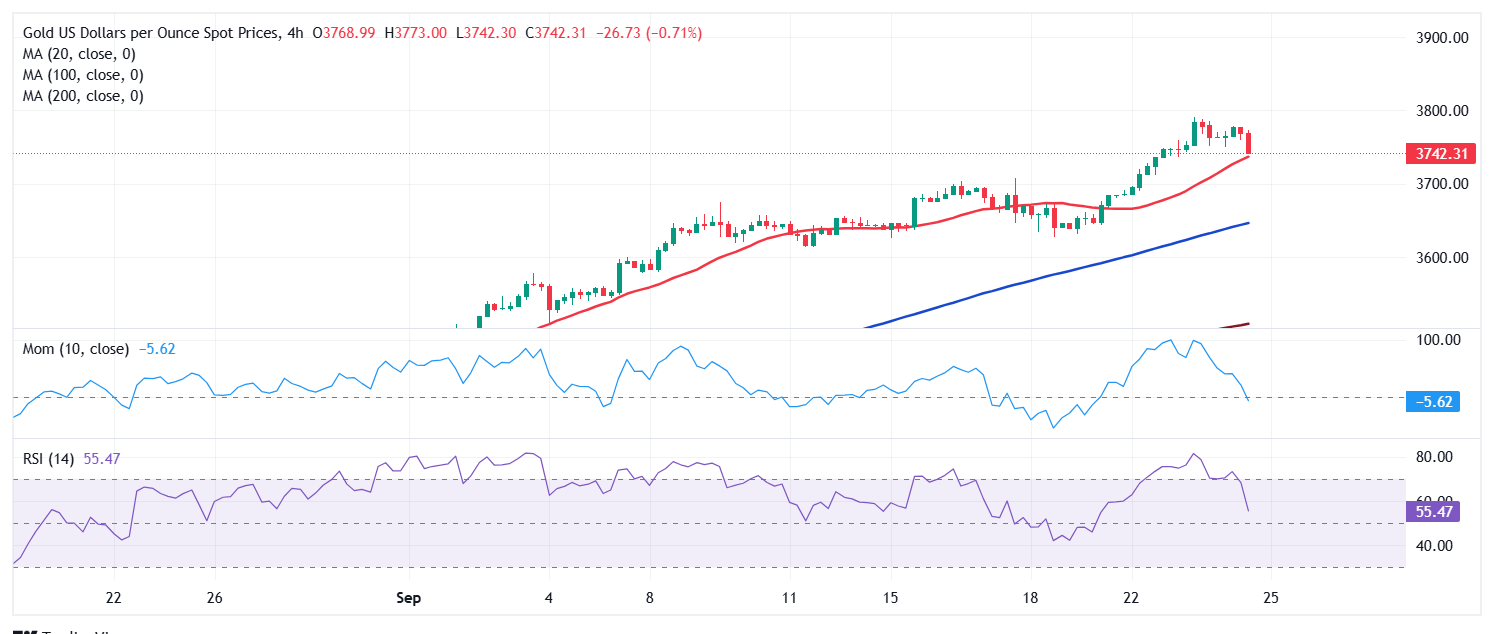
The near-term picture hints at another leg lower. Technical indicators in the 4-hour chart head south almost vertically, easing from extreme overbought readings and approaching their midlines. A bullish 20 Simple Moving Average (SMA) offers immediate support at $3,736.00, while the 100 and 200 SMAs maintain their strong upward slopes far below the shorter one.
Support levels: 3,736.00 3,722.54 3,707.40
Resistance levels: 3,758.80 3,779.15 3,791.00
Premium
You have reached your limit of 3 free articles for this month.
Start your subscription and get access to all our original articles.
Author

Valeria Bednarik
FXStreet
Valeria Bednarik was born and lives in Buenos Aires, Argentina. Her passion for math and numbers pushed her into studying economics in her younger years.