Gold Price Forecast: XAU/USD corrective slide may extend below $2,600

XAU/USD Current price: $2,636.30
- Stock markets struggle to extend gains at the beginning of the week.
- United States employment data takes centre stage after Fed’s rate cut.
- XAU/USD in a corrective phase, additional slides in the docket with $2,575 at sight.
Gold price is down for a second consecutive day, trading at around $2,635 in the mid-American session. The bright metal eased despite a mixed market mood. Generally speaking, financial markets are optimistic amid easing interest rates among major economies. Investors also welcomed Chinese stimulus measures announced last week aimed at reviving the battered economy.
Nevertheless, stock markets are struggling at the beginning of the new week. Most Asian indexes closed in the green, although Japanese ones edged lower following news that former Defense Chief Shigeru Ishiba won the Liberal Democratic Party’s (LDP) presidential election. The upcoming Prime Minister is expected to favor interest rate hikes by the Bank of Japan (BoJ), hurting stocks demand.
Meanwhile, European indexes edged lower amid tepid news from the automakers´ sector, as big names paint a gloomy earnings picture ahead. As a result, United States (US) indexes trade with losses, supporting US Dollar’s advance against most major rivals.
In the upcoming days, however, the focus will move away from stocks and centre around US employment data. The country will publish the JOLTS Job Opening report and the ADP National Employment Report on private job creation ahead of the Nonfarm Payrolls (NFP) release on Friday. The labor market situation in the US may become less of a concern after the Federal Reserve (Fed) delivered a 50 basis points (bps) rate cut when it met in September.
Finally, it’s worth remembering that China celebrates the Golden Week starting on Tuesday, October 1, which means local markets will remain closed for the rest of the week, limiting price action after Wall Street closes.
XAU/USD short-term technical outlook
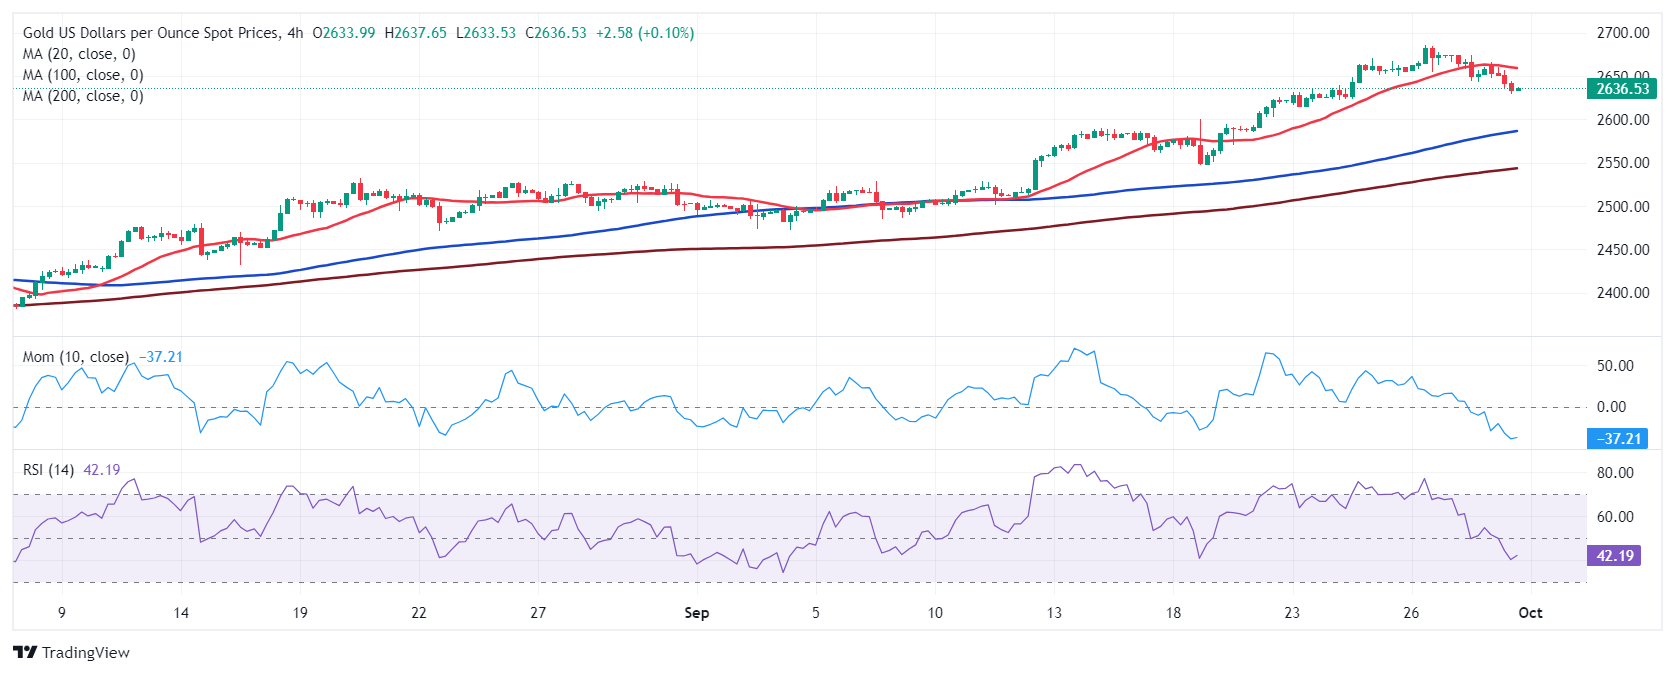
From a technical point of view, the daily chart for the XAU/USD pair shows the recent decline could be categorised as corrective, yet with scope to keep declining in the next few days. Technical indicators have abandoned overbought territory and head firmly south, although well into positive territory. At the same time, moving averages maintain their firm bullish slopes far below the current level, limiting the mid-term bearish potential of Gold. The 20 Simple Moving Average (SMA) currently stands at around $2,575, and an approach to it should attract buyers.
In the near term, and according to the 4-hour chart, the risk also skews to the downside. XAU/USD has broken below a now mildly bearish 20 SMA while holding above bullish 100 and 200 SMAs. Technical indicators, in the meantime, have fallen well into negative territory, maintaining uneven bearish strength. The daily low at $2,628.66 offers immediate support.
Support levels: 2,628.60 2,611.90 2,598.70
Resistance levels: 2,653.70 2,665.95 2,685.45
Premium
You have reached your limit of 3 free articles for this month.
Start your subscription and get access to all our original articles.
Author

Valeria Bednarik
FXStreet
Valeria Bednarik was born and lives in Buenos Aires, Argentina. Her passion for math and numbers pushed her into studying economics in her younger years.


