Gold Price Forecast: XAU/USD bull-bear tug-of-war continues ahead of key US data
- Gold price drifts lower early Tuesday after defending the $3,260 support on Monday.
- The US Dollar bounces amid US trade deal optimism, rebalancing ahead of key data.
- Gold price teases a rising channel breakdown, but the daily RSI remains above the midline.

Gold price replicates Monday’s early moves in Asian trading on Tuesday, testing the critical daily support line at $3,330. Resurgent US Dollar (USD) demand amid an upbeat market mood seems to be weighing on the Gold price.
Gold price remains at the mercy of trade headlines
Gold sellers are fighting back control as renewed optimism surrounding a likely progress in US trade talks with its major trading partners underpinned risk appetite, lifting the US Dollar against its major currency rivals.
On Monday, US Treasury Secretary Scott Bessent said that several top trading partners had made "very good" proposals to avoid US tariffs, with India likely to be among the first to finalize a deal.
Meanwhile, US President Donald Trump’s softer stance on China. Followed by Beijing’s recent moves to exempt certain US goods from its retaliatory tariffs offered a sense of relief to markets, reviving the USD’s demand at a time when markets are resorting to rebalancing as a dramatic month of April draws to a close.
Traders are also refraining from placing any fresh directional bets on the Greenback and the Gold price ahead of Wednesday’s US first-quarter (Q1) advance Gross Domestic Product (GDP), which will reflect a hit the real economy has taken due to Trump’s tariffs.
If the GDP data surprises with a contraction in the reported period, recessionary fears will rekindle, driving the ultimate safe-haven Gold price through the roof. Therefore, Gold price remains exposed to two-sided risks heading into the critical US data releases.
In the meantime, trade headlines and the end-of-the-month repositioning will play a pivotal role in driving the Gold price action.
Gold price technical analysis: Daily chart
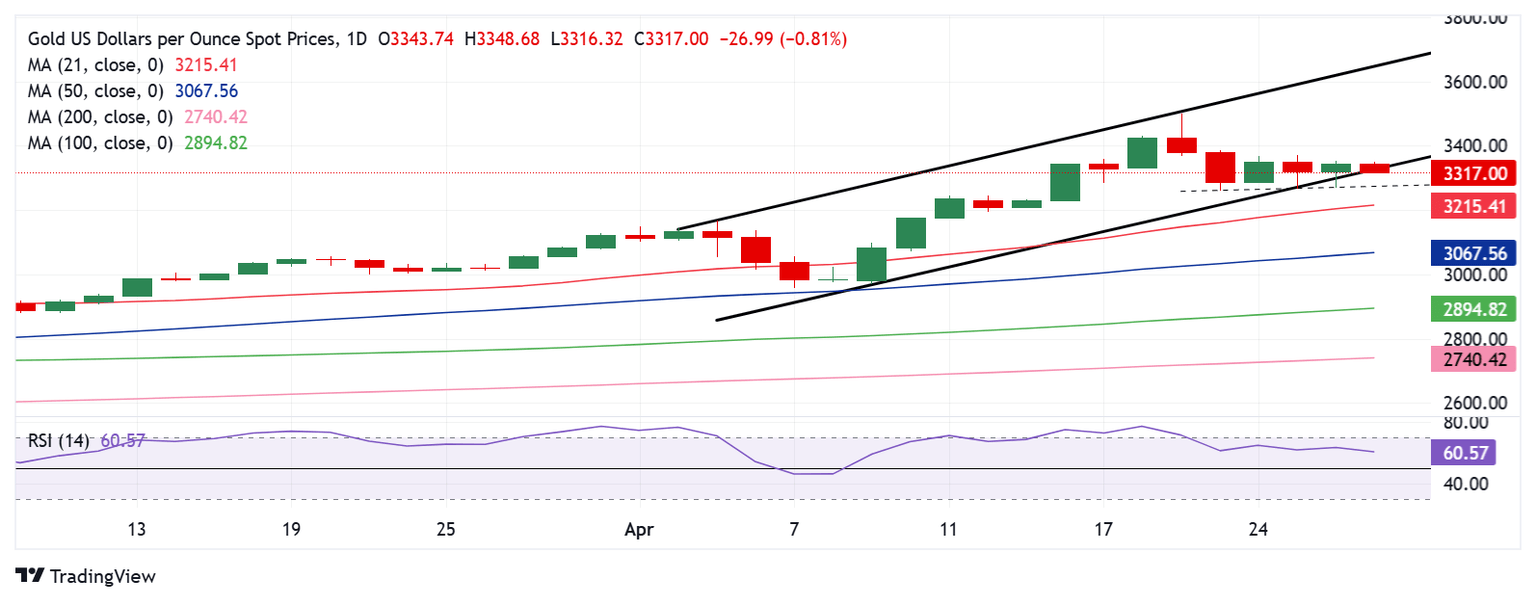
Technically, Gold price is back at teasing the downside break from a three-week-long rising channel formation on the daily chart, following a failed attempt on Monday.
However, with the 14-day Relative Strength Index (RSI) still above the midline, any downward move could be quickly bought into. The leading indicator has turned slightly lower near 61, as of writing.
Gold price must close Tuesday below the rising trendline support at $3,300 to validate a rising channel breakdown. The immediate healthy support aligns in the $3,260 region.
A sustained break below the latter will open doors for a fresh downtrend toward the $2,975 region, where the record rally began in early April.
Ahead of that level, the 21-day Simple Moving Average (SMA) at $3,215 and the 50-day SMA at $3,068 will challenge bullish commitments.
Conversely, if Gold buyers defend the abovementioned channel support at $3,300, a rebound toward the $3,370 static resistance will be inevitable.
A sustained recovery will target the $3,400 and the record high of $3,500 thereafter.
Tariffs FAQs
Tariffs are customs duties levied on certain merchandise imports or a category of products. Tariffs are designed to help local producers and manufacturers be more competitive in the market by providing a price advantage over similar goods that can be imported. Tariffs are widely used as tools of protectionism, along with trade barriers and import quotas.
Although tariffs and taxes both generate government revenue to fund public goods and services, they have several distinctions. Tariffs are prepaid at the port of entry, while taxes are paid at the time of purchase. Taxes are imposed on individual taxpayers and businesses, while tariffs are paid by importers.
There are two schools of thought among economists regarding the usage of tariffs. While some argue that tariffs are necessary to protect domestic industries and address trade imbalances, others see them as a harmful tool that could potentially drive prices higher over the long term and lead to a damaging trade war by encouraging tit-for-tat tariffs.
During the run-up to the presidential election in November 2024, Donald Trump made it clear that he intends to use tariffs to support the US economy and American producers. In 2024, Mexico, China and Canada accounted for 42% of total US imports. In this period, Mexico stood out as the top exporter with $466.6 billion, according to the US Census Bureau. Hence, Trump wants to focus on these three nations when imposing tariffs. He also plans to use the revenue generated through tariffs to lower personal income taxes.
Premium
You have reached your limit of 3 free articles for this month.
Start your subscription and get access to all our original articles.
Author

Dhwani Mehta
FXStreet
Residing in Mumbai (India), Dhwani is a Senior Analyst and Manager of the Asian session at FXStreet. She has over 10 years of experience in analyzing and covering the global financial markets, with specialization in Forex and commodities markets.


