Gold Price Forecast: XAU/USD bounces from intraday lows, upside limited

XAU/USD Current price: $3,367.06
- The US Dollar temporarily benefited from upbeat United States data.
- Focus returns to trade deals and mounting tensions between Trump and Powell.
- XAU/USD recovered from around $3,345, lacks additional momentum.
Spot Gold is in the red on Thursday, down for a second consecutive day amid a better market mood undermining demand for the bright metal. The XAU/USD eased from a Wednesday’s peak at $3,439.07, and traded as low $3,351.55 on Thursday, falling on the back of encouraging United States (US) data. Initial Jobless Claims rose by less than anticipated in the week ended July 19, signaling a healthy labor market ahead of the Federal Reserve (Fed) monetary policy decision and the July Nonfarm Payrolls (NFP) report.
Also, the preliminary estimates of the US July S&P Global Purchasing Managers’ Index (PMI) indicated that US business activity grew at a faster in July, with the composite index rising to 54.6 from the previous month’s 52.9. Services output increased while manufacturing activity declined in the same period.
However, the US Dollar (USD) strength was short-lived, overshadowed by risk-on news. The US sealed a trade deal with Japan on Wednesday, and hinted at another one coming with the Eurozone ahead of the deadline set on August 1. Wall Street rallied towards record highs, holding nearby at the time of writing.
Other than that, speculative interest remained away from mounting US political tensions. US President Donald Trump's personal war against Fed Chairman Jerome Powell has put investors on edge these last few days, maintaining the Greenback on the back foot.
XAU/USD short-term technical outlook
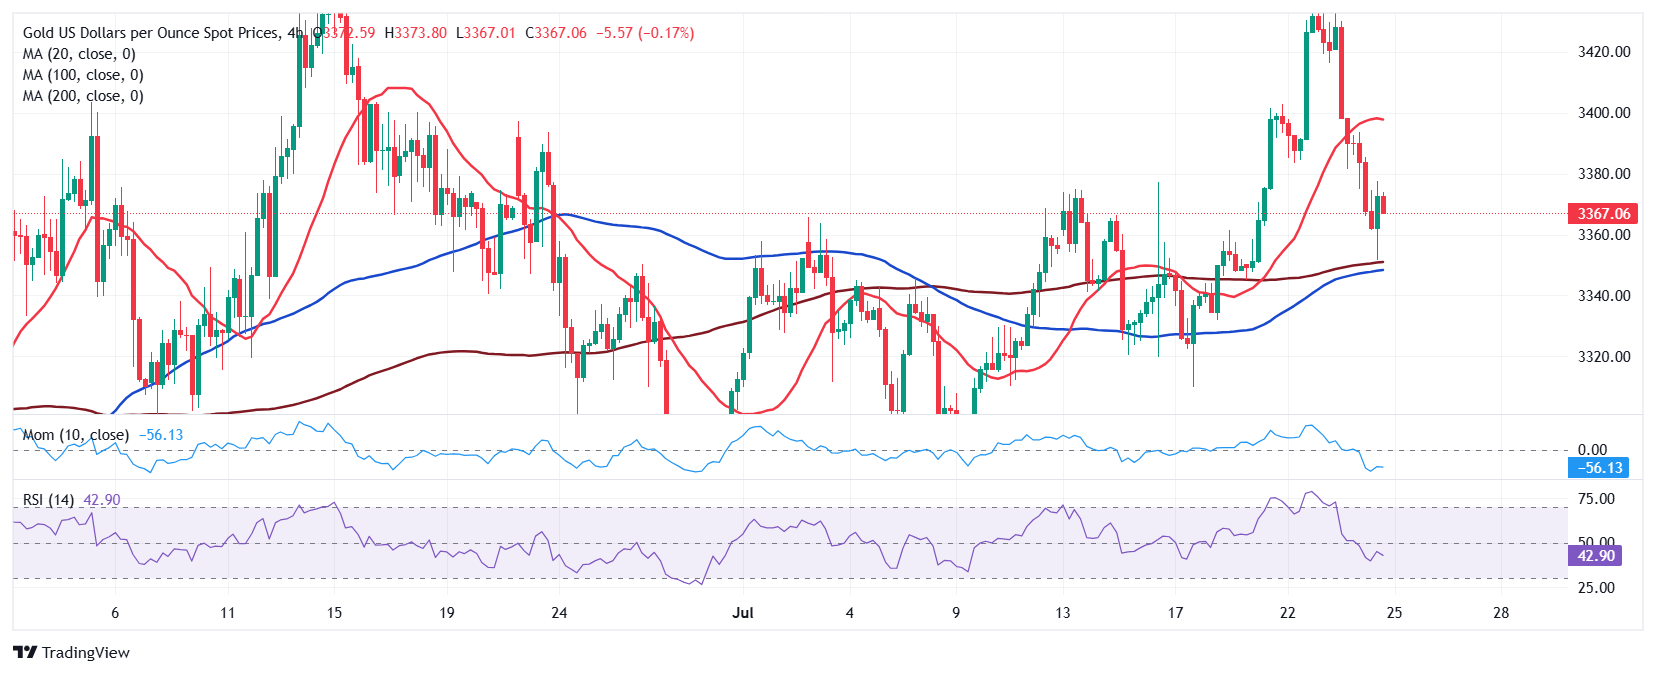
From a technical point of view, the daily chart for the XAU/USD pair shows it bottomed near a flat 20 Simple Moving Average (SMA), providing dynamic support at around $3,342.50. The 100 and 200 SMAs, in the meantime, maintain their upward slopes below the shorter one, in line with the long-lasting bullish trend and despite the ongoing retracement. Finally, technical indicators ease, but remain above their midlines, hinting at a limited bearish potential.
In the near term, and according to the 4-hour chart, the XAU/USD pair bounced from around converging and directionless 100 and 200 SMA, currently at around $3,350. At the same time, the 20 SMA has lost its bullish momentum after the price fell below it, now acting as dynamic resistance in the $3,400 area, reinforcing the relevance of the resistance. Finally, technical indicators tick higher, but remain within negative levels, not enough to support another leg north.
Support levels: 3,342.50 3,331.70 3,318.40
Resistance levels: 3,377.10 3,395.55 3,407.80
Premium
You have reached your limit of 3 free articles for this month.
Start your subscription and get access to all our original articles.
Author

Valeria Bednarik
FXStreet
Valeria Bednarik was born and lives in Buenos Aires, Argentina. Her passion for math and numbers pushed her into studying economics in her younger years.


