Gold Price Forecast: XAU/USD bears eye acceptance below 21 DMA after bearish wedge confirmation
- Gold price pauses its corrective decline, as 21-Day Moving Average comes to the rescue again.
- Dismal US earnings, recession fears revive US Dollar’s safe-haven demand, keeping Gold price vulnerable.
- Bearish wedge remains in play amid a bullish RSI, where is Gold price headed next?

Gold price is looking to find its feet below $2,000 early Thursday after witnessing a volatile session on Wednesday. The United States Dollar (USD) is consolidating its renewed uptick amid a pause in the US Treasury yields advance.
Markets await the mid-tier United States economic releases, in the weekly Jobless Claims and Existing Home Sales, for fresh hints on the US economy and the US Federal Reserve (Fed) interest rates outlook. Speeches from the Fed policymakers, Christopher Waller and Michelle Bowman, will be also closely scrutinized before the Fed enters its ‘blackout period’, starting April 22.
Risk aversion underpins US Dollar
Risk-off flows extend into Asia this Thursday, keeping the safe-haven demand for the US Dollar underpinned, as investors trade with caution amid growing recession fears and discouraging US earnings reports. Investors sentiment was hit on Wednesday after the United Kingdom’s annualized Consumer Price Index (CPI) softened less than expected in March, arriving at 10.1% vs. 9.8% expected. This fanned expectations that the Bank of England (BoE) will need to stay committed to its rate hike trajectory to tame stubbornly high inflation. Meanwhile, the European Central Bank (ECB) policymakers are still contemplating between a 25 basis points (bps) or 50 bps rate hike at the upcoming meeting.
On the other side of the Atlantic, New York Fed President John Williams emphasized in his speech late Wednesday, “Inflation is still too high, and we will use our monetary policy tools to restore price stability.”
Expectations that the global central banks will keep up with interest rate increases to curb inflation fuelled worries over mounting recession risks. Talks of higher rates for longer spiked up US Treasury bond yields across the curve, lifting the US Dollar alongside at the expense of the Gold price. However, the late retreat in the US Treasury bond yields on Wednesday helped Gold price stage a solid comeback from a two-week low of $1,969.
The Greenback also found support from a dour market mood, as investors assessed recession risks. Poor Netflix results were followed by a revenue miss in Tesla’s earnings reports, which spooked markets further and kept the US Dollar bulls motivated. Tesla reported Q1 revenue of $23.33 billion, slightly below Street estimates of $23.35 billion, with Q1 adjusted EPS coming in at $0.85, below Street estimates of $0.86.
Gold price technical analysis: Daily chart
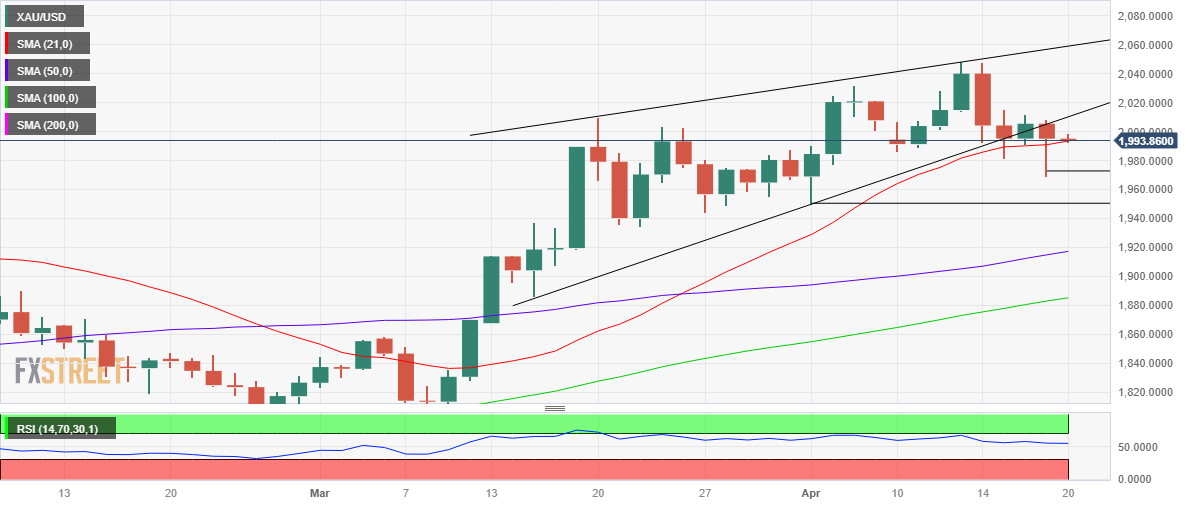
Gold price closed Wednesday below the rising wedge support, then at $2,004, confirming a downside break from the wedge.
Gold bears yielded a decisive break below the bullish 21-Daily Moving Average (DMA) at $1,993 but bulls managed to jump back into the game and reclaimed the latter at close.
In Thursday’s trading so far, Gold price is challenging the 21 DMA support, awaiting acceptance below the latter on a daily closing basis to unleash further downside.
A sustained move below the 21 DMA hurdle will put the previous day’s low of $1,969 at risk, below which Gold sellers will target 1,950, the confluence of the key psychological level and April 3 low.
The 14-day Relative Strength Index (RSI), however, continues to hold above the midline, warranting caution for Gold bears.
If ‘buy-the-dips’ trading extends in Gold price, then bulls reattempt the wedge support-turned-resistance at $2,010.
The recovery could gains further traction above the latter, with eyes on the static resistance at $2,015 and the $2,020 round figure.
Premium
You have reached your limit of 3 free articles for this month.
Start your subscription and get access to all our original articles.
Author

Dhwani Mehta
FXStreet
Residing in Mumbai (India), Dhwani is a Senior Analyst and Manager of the Asian session at FXStreet. She has over 10 years of experience in analyzing and covering the global financial markets, with specialization in Forex and commodities markets.


