Gold Price Forecast: XAU/USD battling to recover its shine

XAU/USD Current price: $3,733.93
- Upbeat United States data boosted the US Dollar, while undermining demand for high-yielding assets.
- The US will publish August Personal Consumption Expenditures Price Index data on Friday.
- XAU/USD confined to a tight range with a modest downward tilt.
Gold price consolidates in a tight range around the $3,730 level in the American session on Thursday, as the market attention falls elsewhere. Investors are pricing in the latest round of upbeat United States (US) data, which fueled demand for the US Dollar (USD) while hitting Wall Street.
The Greenback soared after the US reported that the final estimate of the Q2 Gross Domestic Product (GDP), as annualized growth was upwardly revised to 3.8% from the previous estimate of 3.3%. Furthermore, Durable Goods Orders were up 2.9% in August, much better than the previous -2.6% slide of the anticipated -0.5%. Finally, Initial Jobless Claims for the week ended September 27 were up by 218K, better than the expected 235K and down from the 232K posted in the previous week.
The news, while boosting demand for the USD, took its toll on stocks’ markets as it cooled further down expectations for aggressive Federal Reserve (Fed) interest rate cuts. The poor performance of Wall Street helps to keep XAU/USD afloat amid resurgent safe-haven demand.
On Friday, the US will release an update on inflation. The country will unveil August Personal Consumption Expenditures (PCE) Price Index data, with the core annualized reading foreseen at 2.9%, matching the July figure. Other than that, the country will publish the final estimate of the Michigan Consumer Sentiment Index for September.
XAU/USD short-term technical outlook
The daily chart for the XAU/USD pair shows it hovers around its daily opening, confined to a tight intraday range. The odds for a steeper decline seem unlikely, as the pair is holding well-above all its moving averages, with a firmly bullish 20 Simple Moving Average (SMA) currently at around $3,633. At the same time, the Momentum indicator keeps easing, although withing positive levels, reflecting the absence of fresh buying interest rather than hinting at another leg south.
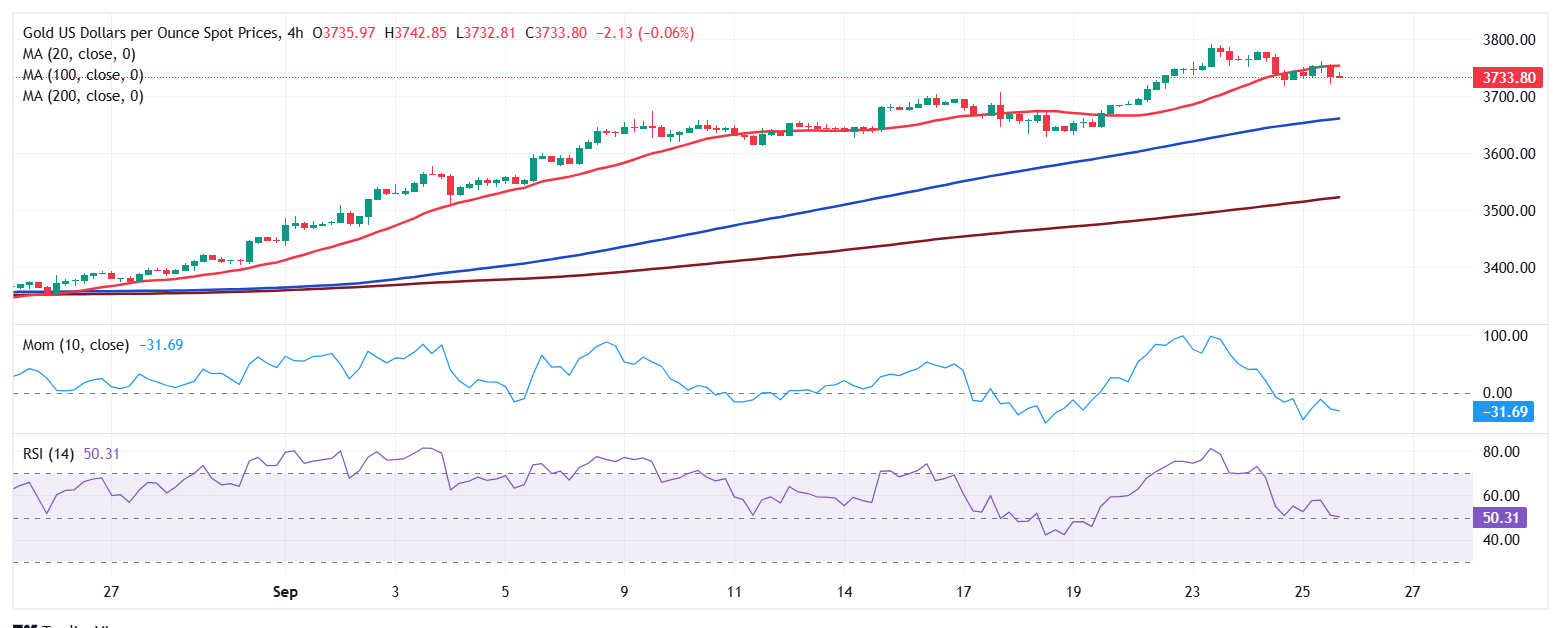
In the near term, and according to the 4-hour chart, the XAU/USD is at risk of shedding some extra ground. The pair develops below a flat 20 SMA, while still above bullish 100 and 200 SMAs. At the same time, the Momentum indicator aims firmly lower within negative levels, while the Relative Strength Index (RSI) indicator aims lower, yet around its 50 level.
Support levels: 3,722.54 3,707.40 3,691.90
Resistance levels: 3,758.80 3,779.15 3,791.00
Premium
You have reached your limit of 3 free articles for this month.
Start your subscription and get access to all our original articles.
Author

Valeria Bednarik
FXStreet
Valeria Bednarik was born and lives in Buenos Aires, Argentina. Her passion for math and numbers pushed her into studying economics in her younger years.


