Gold Price Forecast: XAU/USD battles to extend gains beyond $1,960

XAU/USD Current price: $1,961.24
- Financial markets trade cautiously optimistic as bets on no more rate hikes rose.
- Federal Reserve Chairman Jerome Powell will participate in an IMF discussion panel.
- XAU/USD recovers from a fresh weekly low, needs to run past $1,965 to become attractive for buyers.
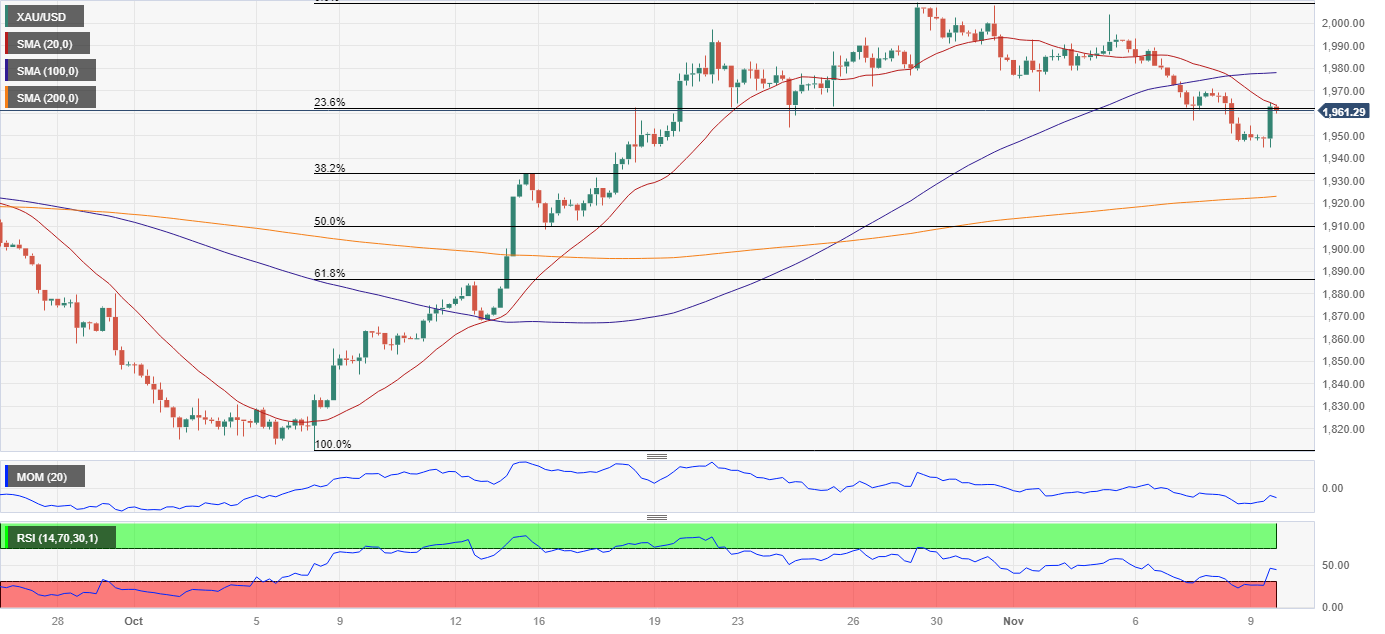
The US Dollar maintained its positive tone throughout the first half of the day but changed course after the American opening. As a result, XAU/USD bounced from a fresh weekly low of $1,944.71 to trade above the $1,960 mark. Financial markets maintain cautious optimism amid hopes central banks are done with monetary tightening, despite policymakers insisting on keeping the door open for additional rate hikes.
Richmond Federal Reserve Bank President Thomas Barkin delivered some encouraging words on Thursday, as he said the economy is “remarkably” healthy, noting real progress on inflation. He also added that the job is not yet done, as inflation remains high. Finally, he said that any downturn might be less severe than in past recessions and that the labor market is now more balanced.
In a separate event, Atlanta Fed President Raphael Bostic reiterated that the full effects of the recent policy are yet to be seen. Later in the day, US Fed Chairman Jerome Powell will participate in a panel discussion titled “Monetary Challenges in a Global Economy” at the International Monetary Fund (IMF) and could comment on monetary policy.
XAU/USD short-term technical outlook
The daily chart for XAU/USD shows bulls are giving it another try, as the pair aims to overcome the 23.6% Fibonacci retracement of the $1,810.41/$,009.34 rally at $1,962.20. It turned positive for the day, but it also posted a lower high and a lower low while developing below a bullish 20 Simple Moving Average (SMA). Finally, technical indicators are ticking marginally higher, although within neutral levels.
In the near term, and according to the 4-hour chart, XAU/USD met sellers around a bearish 20 SMA, which extends its slide below a flat 100 SMA. An advance beyond the indicator should encourage buyers and result in further intraday gains. Technical indicators, in the meantime, aim north within negative levels.
Support levels: 1,945.20 1,933.20 1,923.10
Resistance levels: 1,965.30 1,978.30 1,989.00
Author

Valeria Bednarik
FXStreet
Valeria Bednarik was born and lives in Buenos Aires, Argentina. Her passion for math and numbers pushed her into studying economics in her younger years.

















