Gold Price Forecast: XAU/USD awaits Powell amid Iran-Israel ceasefire, July Fed rate cut talks
- Gold price bounces-off nine-day lows near $3,335 early Tuesday on reviving July Fed rate cut talks.
- US Dollar corrects sharply from the monthly top on a Iran-Israel ceasefire and dovish Fed expectations.
- Gold price looks to Fed Powell’s testimony as the 50-day SMA is tested; the daily RSI teases the midline.

Gold price is off the nine-day low, attempting a tepid recovery early Tuesday amid a positive shift in risk sentiment and the ongoing US Dollar (USD) correction.
Gold price eyes Powell’s testimony for fresh policy cues
Gold price has managed to defend critical support levels so far, as it remains on the back foot for the third consecutive day.
The Iran-Israel ceasefire announcement by US President Donald Trump and later by Iranian Foreign Minister Abbas Araghchi added to the bearish momentum in the traditional safe-haven Gold price.
Further, the sharp retracement in Oil prices also contributed to the extra losses in Gold price as weakening black gold reduced its appeal as an inflation hedge.
However, the bright metal found buyers at lower levels amid the ceasefire-led diminishing haven demand for the USD.
Meanwhile, reviving expectations surrounding a US Federal Reserve (Fed) interest rate cut in July also acts as a headwind for the Greenback, supporting the non-yielding Gold price.
Fed Governor Michelle Bowman joined her colleague Christopher Waller in advocating the next rate cut as early as July. Bowman said on Monday, “open to cutting rates as soon as the July FOMC meeting if inflation pressures stay contained.”
Waller noted on Friday, “Fed is in a position to cut the policy rate as early as July.”
Markets are now pricing in a 21% probability that the Fed will lower rates next month as against a 14.5% chance seen last Friday, according to the CME Group’s Fed WatchTool.
Looking ahead, all eyes now remain on Fed Chairman Jerome Powell’s two-day congressional testimony, starting Tuesday for fresh hints on the timings of the next rate cut.
Besides, markets will continue to pay close attention to the Iran-Israel conflict as to whether the ceasefire is maintained. Israeli Military continues to report ballistic missiles launched on Israel from Iran.
Any re-escalation in the Middle East conflict will once again propel the US Dollar at the expense of the Gold price.
Gold price technical analysis: Daily chart
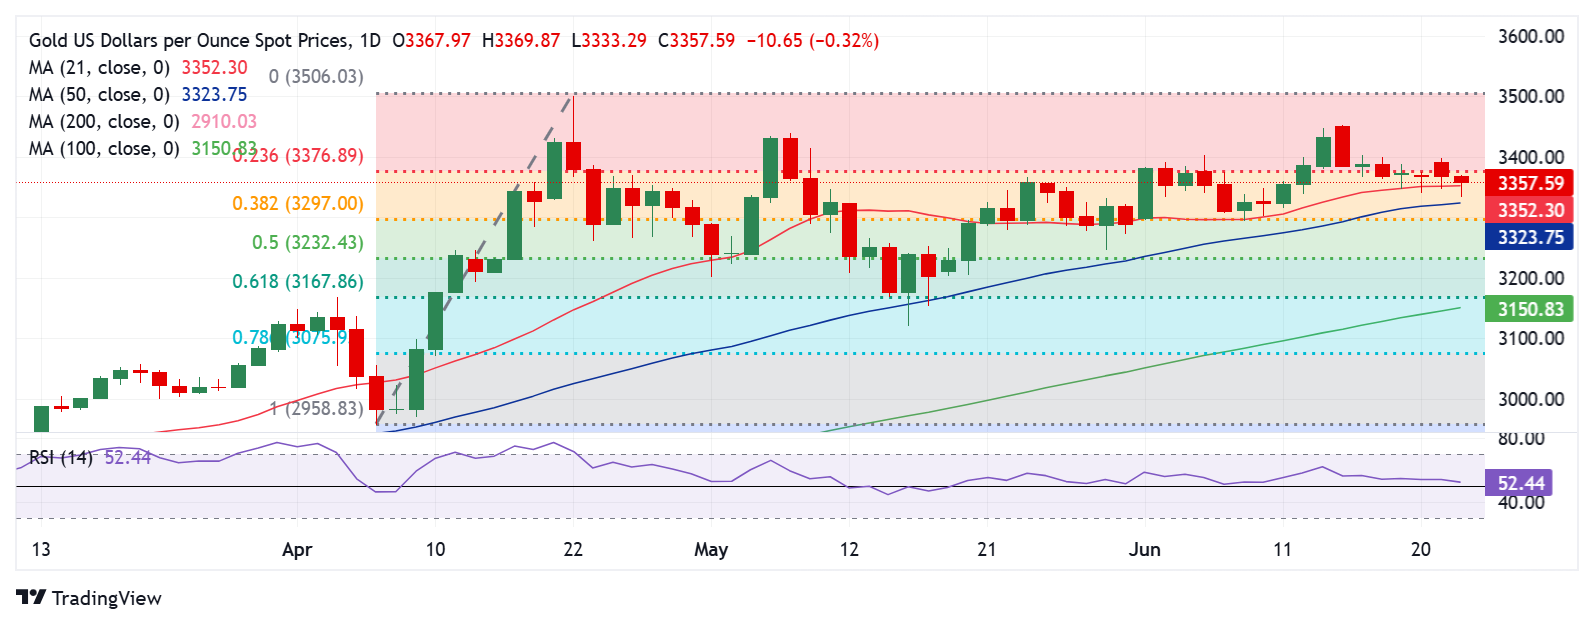
The daily chart shows that Gold price is struggling at around the 21-day Simple Moving Average (SMA) at $3,352 on its recovery from nine-day lows of $3,333.
The yellow metal rebounded from just above the 50-day SMA key support at $3,324.
The 14-day Relative Strength Index (RSI) has turned lower, inching closer to the midline. The leading indicator currently trades near 52.
As it still defends the midline, Gold buyers remain hopeful but yearn for acceptance above the 21-day SMA, followed by the 23.6% Fibonacci Retracement (Fibo) level of the April record rally at $3,377.
The next topside target is seen at $3,400, above which the static resistance at $3,440 will be tested.
A failure to resist above the 21-day SMA on a daily closing basis will attack the 50-day SMA at $3,324, below which the 38.2% Fibo level at $3,297 will be targeted.
Economic Indicator
Fed's Chair Powell testifies
Federal Reserve Chair Jerome Powell testifies before Congress, providing a broad overview of the economy and monetary policy. Powell's prepared remarks are published ahead of the appearance on Capitol Hill.
Read more.Next release: Tue Jun 24, 2025 14:00
Frequency: Irregular
Consensus: -
Previous: -
Source: Federal Reserve
Author

Dhwani Mehta
FXStreet
Residing in Mumbai (India), Dhwani is a Senior Analyst and Manager of the Asian session at FXStreet. She has over 10 years of experience in analyzing and covering the global financial markets, with specialization in Forex and commodities markets.