Gold Price Forecast: XAU/USD at a critical juncture, focus on yields
- Gold fails to benefit from falling Treasury yields, as risk-off boosts the US dollar.
- XAU/USD buyers shrug off the US $1.9 trillion stimulus optimism.
- The 4H technical chart suggests a make-or-break moment for gold.

Gold (XAU/USD) remains under heavy selling pressure so far this Tuesday’s trading, as a four-day losing streak extends amid relentless demand for the US dollar across its main competitors. The retreat in the US Treasury yields amid stabilizing bond markets also fail to offer any reprieve to the XAU bulls. Markets remain concerned about the impact of the recent surge in global yields on the economic recovery prospects.
Further, investors fret that the US $1.9 trillion stimulus passage could further drive the inflation expectations higher, which could propel another leg up in the yields. This could intensify risk-aversion, as the rise in yields could render negative for the global equities. Therefore, the US dollar remains broadly bid, drawing haven demand amid unnerved markets. Meanwhile, upbeat US ISM Manufacturing PMI data also adds to the strength in the greenback, as all eyes remain on the Fed Chair Jerome Powell’s interview and US NFP release scheduled later this week.
In the meantime, the price of gold will remain at the mercy of the US dollar dynamics while the price action in the US Treasury yields will be also closely followed amid a lack of relevant US economic data. Markets could also resort to profit-taking after the recent sell-off.
Gold Price Chart - Technical outlook
Gold: Four-hour chart
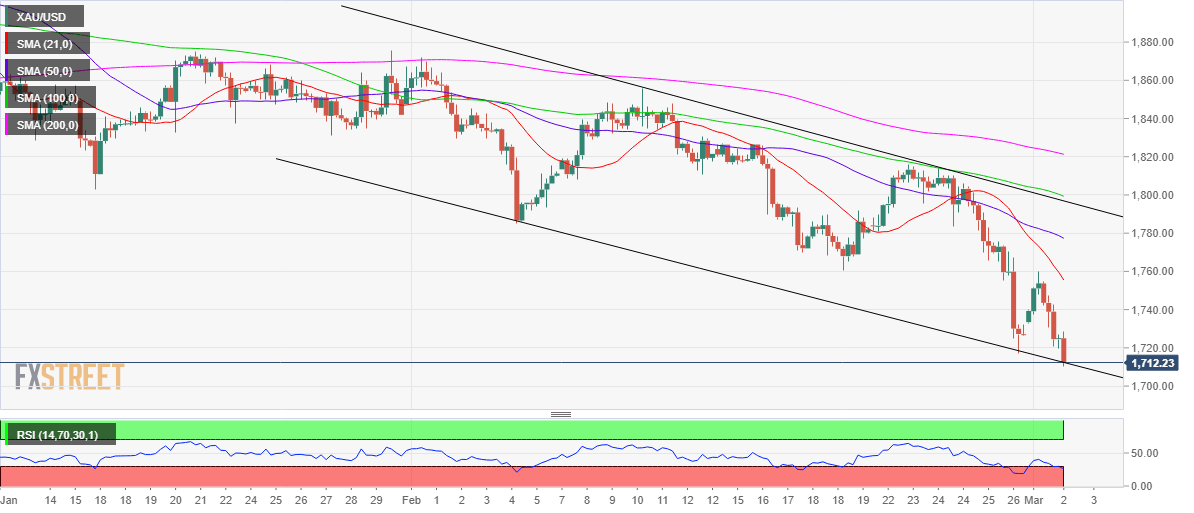
Gold’s four-hour chart shows that the price is on the verge of confirming a falling channel breakdown if it closes the candle below the trendline support at $1712.
Should the pattern get validated, a drop towards the June 2020 lows at $1671 cannot be ruled out.
However, if the XAU bulls manage to defend the critical support, a rebound towards the bearish 21-simple moving average (SMA) at $1755 could be in the offing.
The Relative Strength Index (RSI) trends in the oversold territory, suggesting that the XAU bulls could attempt a corrective pullback from nine-month lows of $1710.50.
The natural tendency of a falling wedge formation is usually a break to the upside.
Author

Dhwani Mehta
FXStreet
Residing in Mumbai (India), Dhwani is a Senior Analyst and Manager of the Asian session at FXStreet. She has over 10 years of experience in analyzing and covering the global financial markets, with specialization in Forex and commodities markets.


