Gold Price Forecast: XAU/USD at a critical juncture, bracing for a Big week ahead
- Gold price kicks off a new week on a negative note, testing key $3,260 support early Monday.
- The US Dollar holds gains amid easing US-China trade tensions, repositioning ahead of key data.
- Gold price eyes a rising channel breakdown as RSI points south while above the midline.

Gold price challenges the previous week’s low at $3,260 early Monday as the corrective pressure regains strength at the start of the week. Markets continue to reposition ahead of a raft of high-impact US economic data releases due later this week.
Gold price yearns for a dip-buying amid the correction
The US Dollar (USD) keeps attracting demand on short-covering and the US-China trade war de-escalation, maintaining the bearish pressure on the USD-denominated Gold price even as the US Treasury bond yields and risk sentiment turn south again.
Markets remain jittery about the economic prospects in the world’s two biggest economies, the United States (US) and China, with highly anticipated US first-quarter (Q1) advance Gross Domestic Product (GDP) and Nonfarm Payrolls (NFP) data on Wednesday and Friday, respectively.
Amid easing US-Sino trade tensions, the focus shifts back toward the US fundamentals and the Federal Reserve’s (Fed) interest rate outlook, which will likely drive the Gold price action in the coming days.
The negative impact of US tariffs will likely be reflected in the US GDP report, and if it prints a negative growth, the odds of a June Fed rate cut will spike up. Expectant of this narrative, Gold price could witness a revival in its uptrend as geopolitical factors continue to remain supportive.
US President Donald Trump on Sunday urged Russia to stop its attacks on Ukraine. At the same time, US Secretary of State Marco Rubio warned that the US could withdraw from peace talks if there’s no meaningful progress, according to Reuters.
Meanwhile, Reuters cited a report from the China Gold Association, stating that the country’s Gold consumption fell by about 6% in Q1, while Gold exchange-traded funds (ETF) holdings in China increased by 327.73% on an annual basis in the same period.
Looking ahead, the Gold price and the USD remain at the mercy of the US trade headlines in the countdown to the critical US data releases, starting Tuesday.
Gold price technical analysis: Daily chart
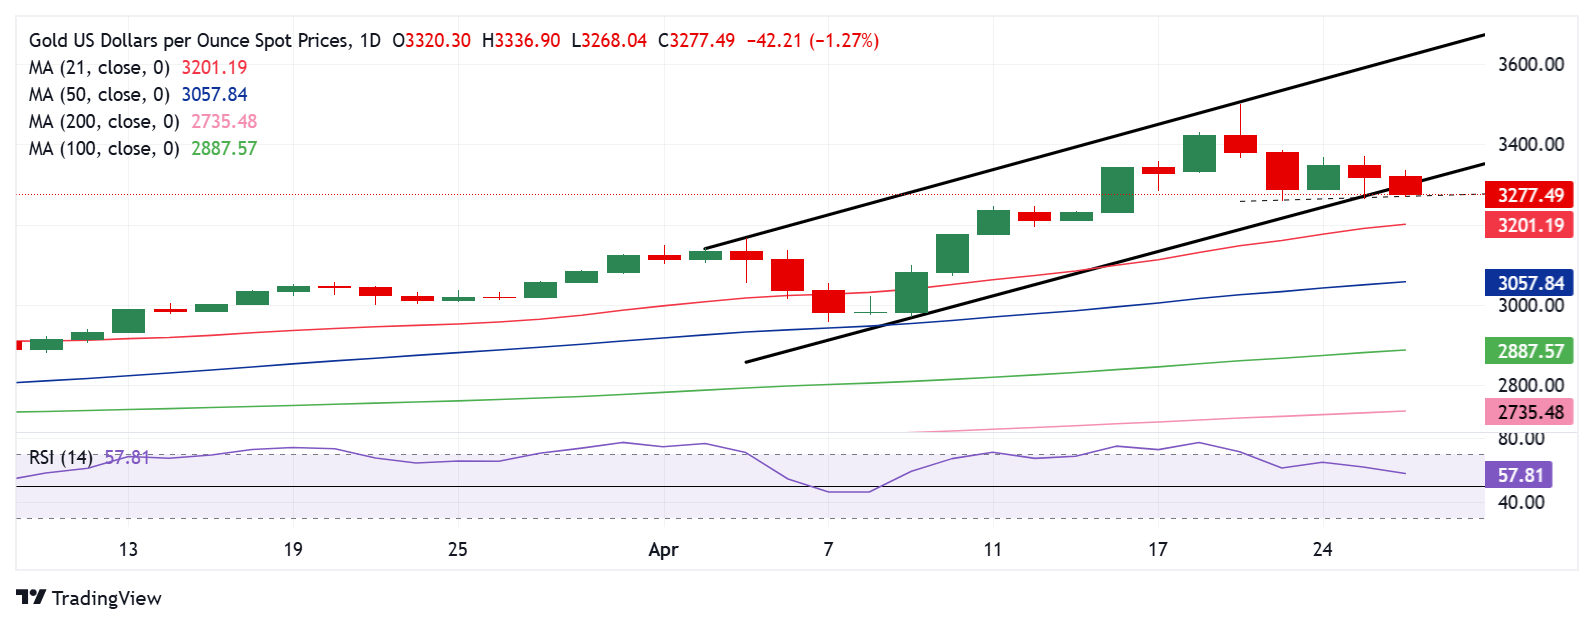
The Gold price record run and the following correction seem to be teasing a downside break from a three-week-long rising channel formation on the daily chart.
The 14-day Relative Strength Index (RSI) points south, currently near 58, backing the latest descent. However, the leading indicator still holds above the midline, suggesting that dip-buying could emerge at the critical $3,260 support area (the previous week’s low).
In case, Gold price closes Monday below the rising trendline support at $3,300, it would confirm a rising channel breakdown, opening doors for a fresh downtrend toward the $2,975 region, from where the record rally began in early April.
The immediate healthy support level aligns at the $3,260 area, below which the 21-day Simple Moving Average (SMA) at $3,200 and the 50-day SMA at $3,058 will be tested.
On the flip side, if Gold buyers manage to defend the abovementioned channel support at $3,300, a rebound toward the $3,370 static resistance will be inevitable.
A sustained recovery will target the $3,400 and the record high of $3,500 thereafter.
Economic Indicator
Gross Domestic Product Annualized
The real Gross Domestic Product (GDP) Annualized, released quarterly by the US Bureau of Economic Analysis, measures the value of the final goods and services produced in the United States in a given period of time. Changes in GDP are the most popular indicator of the nation’s overall economic health. The data is expressed at an annualized rate, which means that the rate has been adjusted to reflect the amount GDP would have changed over a year’s time, had it continued to grow at that specific rate. Generally speaking, a high reading is seen as bullish for the US Dollar (USD), while a low reading is seen as bearish.
Read more.Next release: Wed Apr 30, 2025 12:30 (Prel)
Frequency: Quarterly
Consensus: 0.4%
Previous: 2.4%
Source: US Bureau of Economic Analysis
The US Bureau of Economic Analysis (BEA) releases the Gross Domestic Product (GDP) growth on an annualized basis for each quarter. After publishing the first estimate, the BEA revises the data two more times, with the third release representing the final reading. Usually, the first estimate is the main market mover and a positive surprise is seen as a USD-positive development while a disappointing print is likely to weigh on the greenback. Market participants usually dismiss the second and third releases as they are generally not significant enough to meaningfully alter the growth picture.
Premium
You have reached your limit of 3 free articles for this month.
Start your subscription and get access to all our original articles.
Author

Dhwani Mehta
FXStreet
Residing in Mumbai (India), Dhwani is a Senior Analyst and Manager of the Asian session at FXStreet. She has over 10 years of experience in analyzing and covering the global financial markets, with specialization in Forex and commodities markets.


