|

Gold Price Forecast: XAU/USD approaches record highs

XAU/USD Current price: $2,927.93

  • Peace talks around the Ukraine-Russia war underpinned the mood on Tuesday.
  • Canadian annual inflation held below 2%, further boosting the sentiment.
  • XAU/USD resumed its advance and aims to retest its record high in the $2,942 price zone.

Gold price is up on Tuesday, with XAU/USD approaching the $2,930 mark in the American session. The bright metal resumed its advance after falling to $2,876.93 on Friday, up for a second consecutive day and closing into the record high at $2,942.76 posted this month.

The US Dollar (USD) fell away from investors' radar amid an improved mood, based on hopes that the Russia-Ukraine war would soon end. Russian and United States (US) delegations met in Riyadh to hold peace talks, although without the presence of Ukrainian leaders.

“No decisions about Ukraine without Ukraine … Europe must have a seat at the table when decisions about Europe are being made,” Ukraine’s President Volodymyr Zelensky said at the Munich Security Conference over the weekend. Nevertheless, diplomats from the US and Russia have hailed the meeting in Saudi Arabia as positive.

 Meanwhile, Canada reported that the January Consumer Price Index (CPI) rose by 1.9% over the last twelve months, up from the December reading of 1.8%, and it matched analysts’ expectations. On a monthly basis, prices rose 0.1%, higher than the -0.4% posted in December. The optimistic figures further backed the market mood.

XAU/USD short-term technical outlook

From a technical point of view, the daily chart for XAU/USD shows buyers regained control. Technical indicators resumed their advances after correcting extreme overbought conditions, while the pair develops above all bullish moving averages. Additionally, the 20 Simple Moving Average (SMA) maintains its firmly bullish slope far above the 100 and 200 SMA, which also head north.

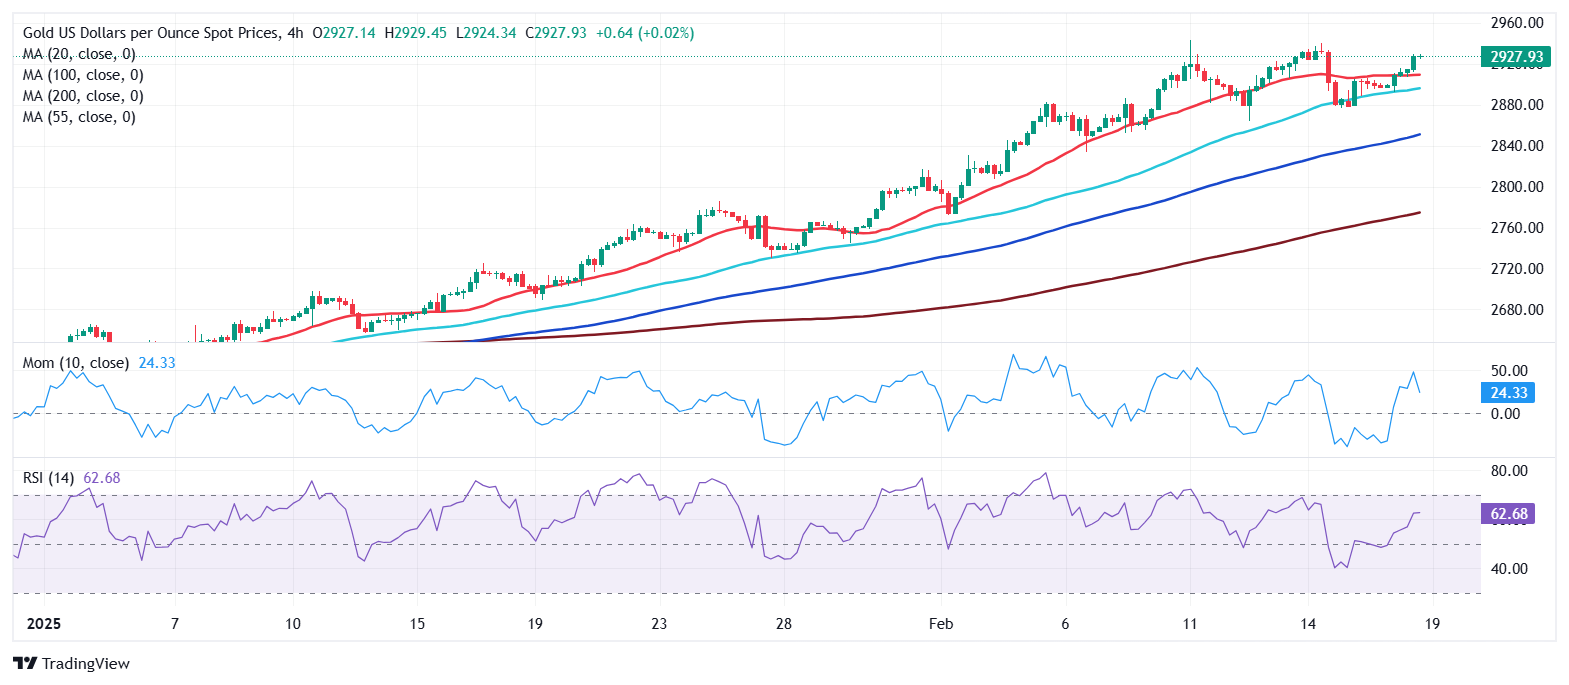
In the near term, and according to the 4-hour chart, XAU/USD has room to extend its advance. The pair recovered above a flat 20 SMA, now providing support at around $2,909.60. The 100 and 200 SMAs, in the meantime, accelerated north far below the shorter one, reflecting buyers' dominance. Finally, technical indicators regained their upward strength, although the Momentum indicator remains below its 100 line.

Support levels: 2,909.60 2,897.10 2,876,90

Resistance levels: 2,942.75 2,960.00 2,975.00 

Premium

You have reached your limit of 3 free articles for this month.

Start your subscription and get access to all our original articles.

Subscribe to PremiumSign In

Author

Valeria Bednarik

Valeria Bednarik was born and lives in Buenos Aires, Argentina. Her passion for math and numbers pushed her into studying economics in her younger years.

More from Valeria Bednarik
Share:

Markets move fast. We move first.

Orange Juice Newsletter brings you expert driven insights - not headlines. Every day on your inbox.

By subscribing you agree to our Terms and conditions.

Editor's Picks

EUR/USD edges higher to mid-1.1600s; looks to US PCE Price Index for fresh impetus

The EUR/USD pair attracts some dip-buyers during the Asian session on Friday and recovers a part of the previous day's retracement slide from the 1.1680 region, or the highest level since October 17. Spot prices currently trade around mid-1.1600s and remain on track to register gains for the second straight week.

GBP/USD: Constructive view prevails above 1.3300 ahead of US PCE inflation data

The GBP/USD pair trades on a flat note near 1.3330 during the Asian trading hours on Friday. Traders prefer to wait on the sidelines ahead of the key US inflation report later on Friday. The US delayed Personal Consumption Expenditures Price Index report for September could offer some hints about the US interest rate path.

Gold flat lines above $4,200 mark; looks to US PCE Price Index for some meaningful impetus

Gold struggles to capitalize on the overnight bounce from the $4,175 area, or the vicinity of the weekly trough, and oscillates in a narrow trading range during the Asian session on Friday. Traders now seem reluctant and opt to move to the sidelines ahead of the September Personal Consumption Expenditures Price Index, or the Federal Reserve's preferred inflation gauge. 

Pi Network: Bearish streak nears critical support trendline

Pi Network edges lower on Friday for the third consecutive day, approaching a local support trendline. The on-chain data suggests an increase in supply pressure as Centralized Exchanges experience a surge in inflows. Technically, the pullback in PI risks further losses, as the Moving Average Convergence Divergence indicator is flashing a sell signal. 

Why the Fed may cut rates in December: Understanding the policy shift

The Fed has gone through a noticeable policy swing in recent months - from initiating a rate cut, to signaling a potential pause, and now shifting once again toward another cut in December. This has created understandable confusion among traders and investors trying to interpret the Fed’s reaction function.

XRP edges lower despite record on-chain activity and steady ETF inflows

Ripple is trading under pressure at the time of writing on Thursday, after bulls failed to break the short-term resistance at $2.22. The reversal may extend toward Monday’s low of $1.98, especially if risk-off sentiment persists in the broader cryptocurrency market.