Gold Price Forecast: XAU/USD approaches $1,900 as odds for a Fed hike increase

XAU/USD Current price: $1,919.83
- Mixed United States data fueled speculation the Federal Reserve could deliver one more hike.
- The US ISM Services PMI unexpectedly jumped to 54.5 in August, beating expectations.
- XAU/USD is technically bearish and poised to test August low at $1,884.77.
The US Dollar keeps marching higher on Wednesday, resulting in XAU/USD extending its slide for a fourth consecutive day. Gold currently trades near an intraday low of $1,915.27 a troy ounce, achieved after the release of mixed United States (US) macroeconomic data.
On the one hand, S&P Global downwardly revised the August Services PMI to 50.5 from 51 previously estimated. The Global PMI was then confirmed at 50.2 in the month against the 50.4 preliminary estimate. The reports indicated a slowdown in growth while noting input prices rose at a steeper pace in August, largely driven by higher wage bills. On the other, economic activity in the services sector expanded in August for the eighth consecutive month, according to the ISM Services PMI, which printed at 54.5, beating the 52.5 expected. Also, The IBD/TIPP Economic Optimism Index surged to 43.2 in September, its highest in five months.
Somehow, macro figures suggested the economy remains resilient but also that inflation-related risks have not cooled enough. As a result, the odds for a Federal Reserve (Fed) 25 basis points (bps) rate hike in November increased to 44.6%, according to the CME FedWatch Tool. Stock markets turned red, further fueling demand for the safe-haven USD.
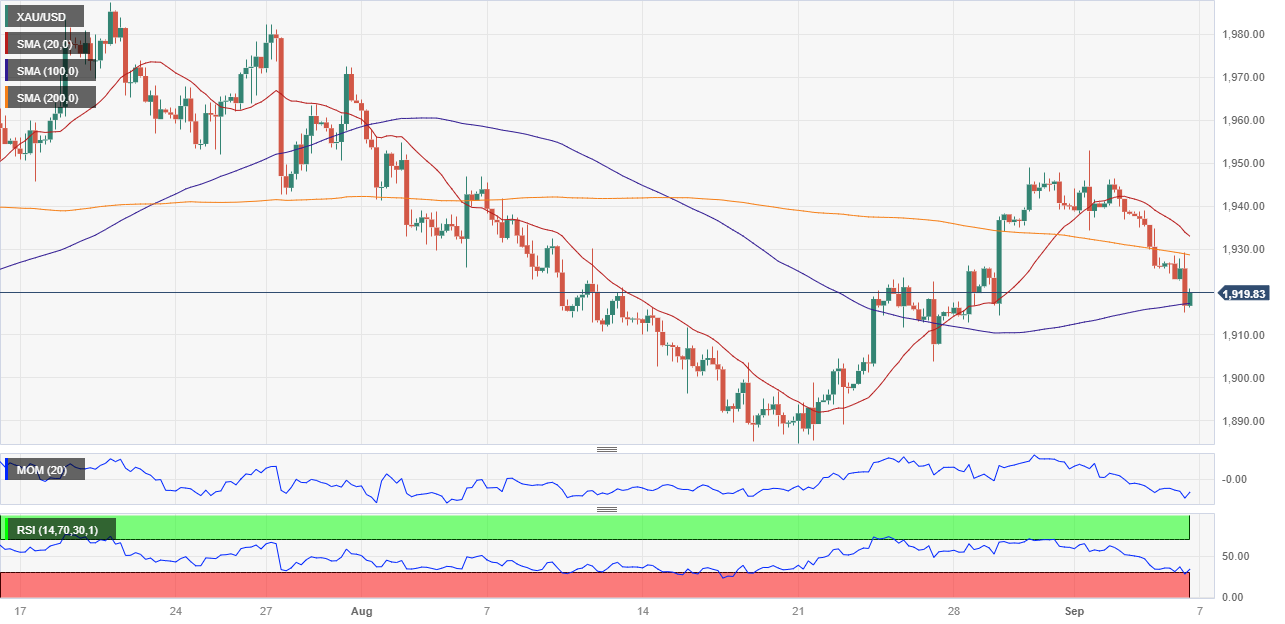
XAU/USD price short-term technical outlook
XAU/USD has extended its slide below the 38.2% Fibonacci retracement of the $1,982.15/$1,884.77 decline at $1,921.80 after briefly trading above the 61.8% retracement last week. Such behavior usually anticipates a downward extension below the range’s low. At the same time, the daily chart shows that the pair is pressuring a dynamic support level as the 20 and 200 Simple Moving Averages (SMAs) converge around $1,915. Meanwhile, the 100 SMA keeps heading south well above the current level, while the Momentum indicator barely turned south just above its 100 line. Nevertheless, the Relative Strength Index (RSI) indicator gains bearish strength at around 45, in line with a continued slide.
For the near term, the bearish case is more evident. The pair briefly pierced a directionless 100 SMA, while the 20 and 200 SMA gain bearish strength far above the current level. Technical indicators, in the meantime, head south almost vertically, approaching oversold readings. The immediate Fibonacci support comes at $1,907.30, the level to clear to confirm a downward extension towards the base of the aforementioned range.
Support levels: 1,907.30 1,893.90 1,982.15
Resistance levels: 1,921.80 1,933.30 1,944.85
Author

Valeria Bednarik
FXStreet
Valeria Bednarik was born and lives in Buenos Aires, Argentina. Her passion for math and numbers pushed her into studying economics in her younger years.


