Gold Price Forecast: XAU/USD aims to recover ahead of US CPI data

XAU/USD Current price: $4,134.50
- The September US Consumer Price Index will be released on Friday.
- The absence of a clear catalyst maintains investors sidelined.
- XAU/USD holds on to modest intraday gains aims to extend its recovery.
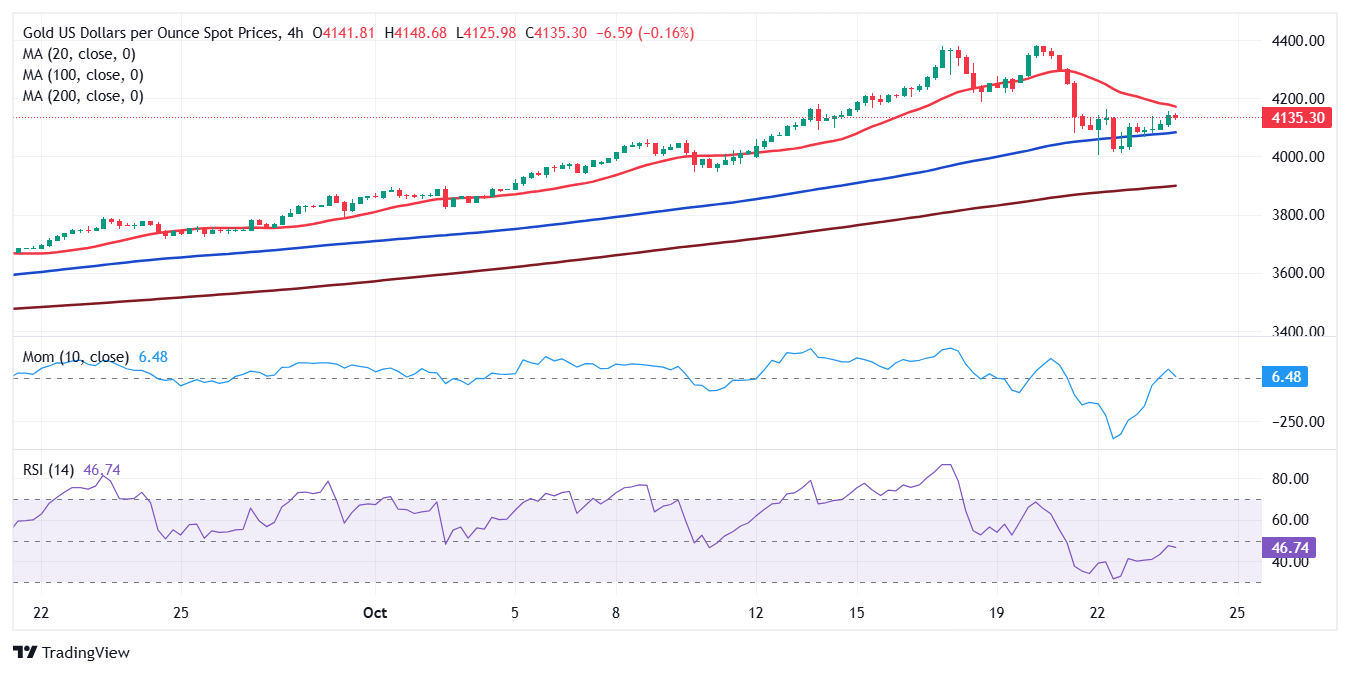
The XAU/USD pair trades with a better tone on Thursday, holding on to intraday gains in the $4,140 region. The US Dollar (USD) came under modest selling pressure after Wall Street’s opening, despite the better tone of American indexes, all trading in the green at the time of writing.
The bright metal has been unable to find a certain directional way for a second consecutive day, as financial markets lack a clear catalyst, given the absence of relevant data or monetary policy hints.
The United States (US) offered some minor figures: Existing Home Sales were up 1.5% in September, improving from the previous 0.2%. Additionally, the October Kansas Fed Manufacturing Activity Index also improved from the previous 4 to 15.
Things could turn a bit more interesting on Friday, as the US will release the September Consumer Price Index (CPI). Inflation, as measured by the CPI, is expected to have risen by 3.1% on a yearly basis, higher than the previous 2.9%. The monthly increase is foreseen at 0.4%. The core annual reading is forecast to match the August reading at 3.1%. Other than that, the University of Michigan will unveil the final reading of the October Consumer Sentiment Index, while S&P Global will release the preliminary estimates of the October Purchasing Managers’ Indexes (PMIs).
XAU/USD short-term technical outlook
The daily chart for the XAU/USD pair shows that the pair may extend its latest recovery. After bouncing from a bullish 20 Simple Moving Average (SMA) on Wednesday, the pair managed to remain above it. Technical indicators, in the meantime, have stabilized well above their midlines after correcting extreme overbought conditions.
The 4-hour chart shows that the pair managed to extend its recovery above a bullish 100 SMA, while it remains below a bearish 20 SMA, the latter acting as resistance at around $4,173. At the same time, the Momentum indicator advances within negative levels, while the Relative Strength Index (RSI) indicator hovers around 47.
Support levels: 4,115.75 4,000.00 3,986.45
Resistance levels: 4,061.20 4,085.70 4,110.00
Author

Valeria Bednarik
FXStreet
Valeria Bednarik was born and lives in Buenos Aires, Argentina. Her passion for math and numbers pushed her into studying economics in her younger years.














