Gold Price Forecast: Will XAU/USD yield a weekly closing above 200DMA?
- Gold price corrects from four-month highs at $1,808, as bulls take a breather.
- United States Dollar looks to stabilize ahead of the critical Nonfarm Payrolls.
- Gold price needs a weekly close above 200-Daily Moving Average to unleash further upside.

Gold price is reversing from a fresh four-month high above $1,800, as bulls take a breather before the United States Nonfarm Payrolls (NFP)-led massive volatility storm. The US Dollar has paused its downward trajectory amid a minor uptick in the US Treasury bond yields and a cautious market mood.
All eyes on United States Nonfarm Payrolls
The US Dollar is consolidating recent declines to four-month troughs against its major peers, fuelling a minor correction in the Gold price from the highest levels since July reached at $1,805 early Friday. The minor uptick in the US Treasury bond yields is also exerting downward pressure on the non-interest-bearing Gold price. Investors are looking to take profits on their USD short positions ahead of the all-important United States Nonfarm Payrolls data.
Yohay Elam, Senior Analyst at FXStreet explains, “My baseline scenario is for the Nonfarm Payrolls to be somewhere between 150,000 and 200,000, above real expectations, thus triggering a short-lived upward move in the US Dollar. From there, it could turn down and resume its decline. Even a read of 250,000 would likely trigger such a two-sided move. This outcome has a high probability.”
Federal Reserve’s favorite inflation gauge cooled
On Thursday, the US Dollar sell-off found extra legs after the Federal Reserve’s preferred inflation gauge, the Core PCE Price Index, declined to 5% YoY in October vs. September’s 5.2%, showing signs of inflation cooling and backing the recent dovish Federal Reserve pivot. Meanwhile, the US ISM said its manufacturing PMI slipped to 49.0 in November from 50.2 in October, registering its first contraction since May 2020. Softer US Dollar propelling Gold price to reach the highest level since July at $1,805.
USD/JPY sell-off downed the US Dollar further
The US Dollar Index tumbled to its lowest in four months below the 105.00 level, as the downside momentum accelerated following a sharp sell-off in the USD/JPY pair on Thursday. The Japanese yen caught a fresh bid-wave and triggered a massive slump in USD/JPY after Bank of Japan (BoJ) board member Asahi Noguchi said that “depending on data, tthe iming of exit from easy policy could be pushed forward.” His comments suggested that the Bank of Japan (BoJ) could be shifting gears toward a hawkish stance.
Gold price technical outlook: Daily chart
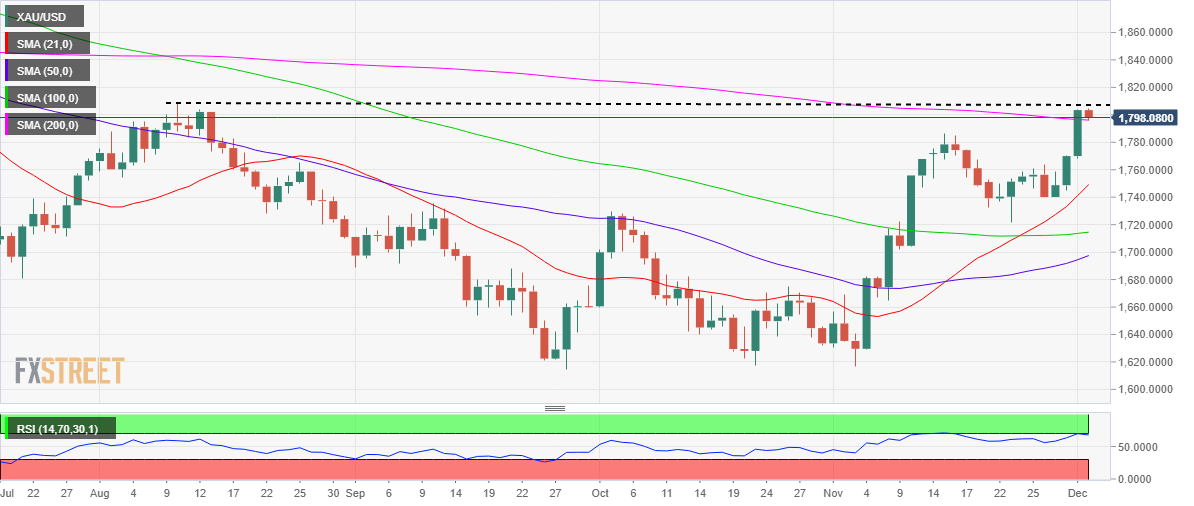
Gold price is retreating to test the critical 200-Daily Moving Average (DMA) at $1,796, at the time of writing.
Gold bulls reclaimed that barrier for the first time since mid-June on Thursday.
The 14-day Relative Strength Index (RSI) has turned flat just beneath the overbought territory, justifying the latest leg down in Gold price.
Should the 200DMA resistance-turned-support give way, then a drop toward the November 15 high at $1,787 cannot be ruled out.
The next corrective target is seen at the previous day’s low of $1,768, below which floors will open up for a test of the bullish 21DMA at $1,749.
Alternatively, Gold buyers year for a weekly closing above the 200DMA, above which the $1,800 mark will be challenged once again.
Further up, the previous day’s high at $1,805 and the August 10 top at $1,808 will be put to test.
Premium
You have reached your limit of 3 free articles for this month.
Start your subscription and get access to all our original articles.
Author

Dhwani Mehta
FXStreet
Residing in Mumbai (India), Dhwani is a Senior Analyst and Manager of the Asian session at FXStreet. She has over 10 years of experience in analyzing and covering the global financial markets, with specialization in Forex and commodities markets.


