Gold Price Forecast: Will XAU/USD avert a rising wedge breakdown?
- Gold price hit a five-day near $2,365 early Thursday, in the aftermath of hawkish Fed Minutes.
- The US Dollar and US Treasury bond yields pause their advances, as sentiment remains tentative.
- Gold price teases rising wedge breakdown and 21-day SMA at $2,350 amid bullish RSI.

Gold price is licking its wound near a five-day low below $2,370 in the Asian session on Thursday. Gold price is on a three-day downtrend, undermined by the hawkish Minutes of the US Federal Reserve (Fed) May policy meeting.
Focus shifts to US PMI data after hawkish Fed Minutes
The Fed Minutes released on Wednesday showed that “various participants mentioned a willingness to tighten policy further should risks to inflation materialize in a way that such an action became appropriate.”
The Minutes also suggested that the Fed officials grew more concerned about the stubbornness of inflation, citing that “the recent monthly data had showed significant increases in components of both goods and services price inflation.”
These statements from the Minutes suggested that the Fed could stick to its ‘higher rates for longer’ stance, weighing further on expectations of interest rate cuts this year. According to CME Group’s FedWatch Tool, bets that the Fed will cut rates more than once in 2024 reduced significantly.
The hawkish Fed Minutes helped the US Dollar regain its recovery momentum, with US Treasury bond yields also rising. This weighed heavily on the non-interest-bearing Gold price.
A recent slew of speeches from several Fed policymakers has also warranted caution on the persistence of inflation, leaning in favor of delayed rate cuts.
However, the uptick in the US Treasury bond yields quickly faded, as US stock markets tanked on the hawkish Fed Minutes and cautiousness ahead of Nvidia’s earnings report, which fuelled safe-haven flows into the US government bonds.
Gold price, however, failed to find reprieve from the US Treasury yields rebound, as it settled the day deep in the red.
In Thursday’s trading so far, Gold price is consolidating the downside, drawing support from a pause in the US Dollar uptrend, as risk sentiment seems to find a boost from robust earnings report of the chip designer and artificial intelligence (AI) giant, Nvidia. Nvidia’s profits and revenues skyrocketed by 628% and 268%, as against 2023’s comparable period, respectively.
However, a sell-off in the Chinese stocks keeps investors on edge. Therefore, Gold traders look forward to the flash readings of the S&P Global US Manufacturing and Services PMIs for affirmed the recent hawkish shit in the Fed’s rate outlook, which could trigger a renewed US Dollar advance.
Gold price technical analysis: Daily chart
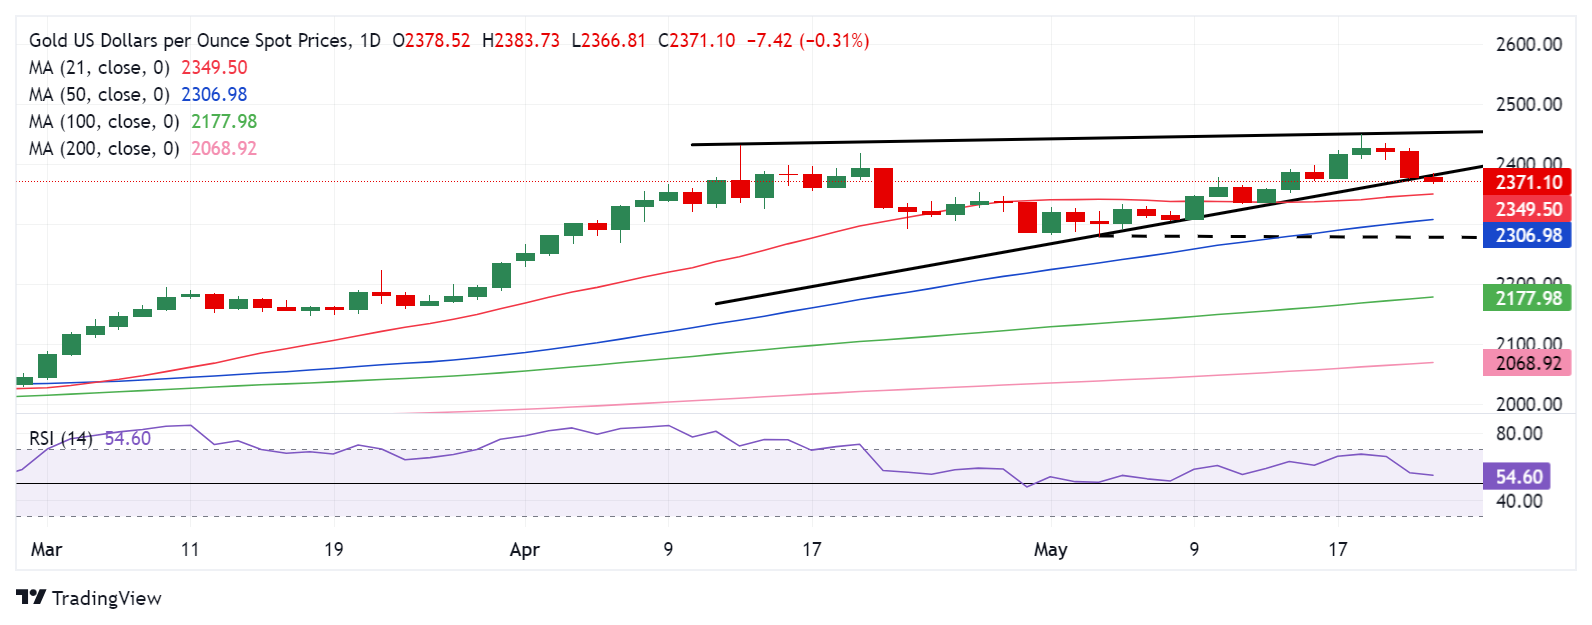
As observed on the daily chart, Gold price opened Thursday below the lower boundary of a five-week-long rising wedge formation, currently at $2,384.
Daily closing below the latter would confirm the rising wedge breakdown, opening the floor for a test of the 50-day Simple Moving Average (SMA) at $2,307.
However, Gold buyers must first defend the 21-day SMA support at $2,350.
A retest of the May low at $2,277 will be inevitable if the downside sustains.
Meanwhile, the 14-day Relative Strength Index (RSI) has slowed its descent while holding above the midline, near 54.60, suggesting that Gold price could meet some bargain-hunting demand.
If Gold buyers manage to avert a downside break of the rising wedge, a rebound toward the $2,400 level will be staged.
Further up, the previous day’s high of $2,427 will be challenged. The next relevant upside target is seen at $2,453, the upper boundary of the bearish wedge.
(This story was corrected on Thursday at 5:52 GMT to say that "Gold price is licking its wound near a five-day low", not high.)
Gold FAQs
Gold has played a key role in human’s history as it has been widely used as a store of value and medium of exchange. Currently, apart from its shine and usage for jewelry, the precious metal is widely seen as a safe-haven asset, meaning that it is considered a good investment during turbulent times. Gold is also widely seen as a hedge against inflation and against depreciating currencies as it doesn’t rely on any specific issuer or government.
Central banks are the biggest Gold holders. In their aim to support their currencies in turbulent times, central banks tend to diversify their reserves and buy Gold to improve the perceived strength of the economy and the currency. High Gold reserves can be a source of trust for a country’s solvency. Central banks added 1,136 tonnes of Gold worth around $70 billion to their reserves in 2022, according to data from the World Gold Council. This is the highest yearly purchase since records began. Central banks from emerging economies such as China, India and Turkey are quickly increasing their Gold reserves.
Gold has an inverse correlation with the US Dollar and US Treasuries, which are both major reserve and safe-haven assets. When the Dollar depreciates, Gold tends to rise, enabling investors and central banks to diversify their assets in turbulent times. Gold is also inversely correlated with risk assets. A rally in the stock market tends to weaken Gold price, while sell-offs in riskier markets tend to favor the precious metal.
The price can move due to a wide range of factors. Geopolitical instability or fears of a deep recession can quickly make Gold price escalate due to its safe-haven status. As a yield-less asset, Gold tends to rise with lower interest rates, while higher cost of money usually weighs down on the yellow metal. Still, most moves depend on how the US Dollar (USD) behaves as the asset is priced in dollars (XAU/USD). A strong Dollar tends to keep the price of Gold controlled, whereas a weaker Dollar is likely to push Gold prices up.
Premium
You have reached your limit of 3 free articles for this month.
Start your subscription and get access to all our original articles.
Author

Dhwani Mehta
FXStreet
Residing in Mumbai (India), Dhwani is a Senior Analyst and Manager of the Asian session at FXStreet. She has over 10 years of experience in analyzing and covering the global financial markets, with specialization in Forex and commodities markets.


