Gold Price Forecast: Why $1830 continues to lure XAU/USD buyers? Focus on US data
- Gold price attempts a bounce amid persisting USD weakness.
- Risk reset-led rebound in yields challenging gold bulls for now.
- Gold’s hourly chart shows more room to the upside ahead of the US data.

Gold price pullback from the highest levels in about four weeks at $1823 on Monday, as it finished the day at $1810, posting moderate losses on the day. Amid holiday-thinned trading, the risk sentiment remained upbeat while the US dollar licked its wounds in the aftermath of the dovish comments from the Federal Reserve Chair Jerome Powell last week. Wall Street indices once again clocked fresh record highs, which weighed on gold’s bullish potential. However, the persistent weakness in the Treasury yields amid easing concerns over an imminent tapering offered some respite to gold buyers. Further, underlying risks of the Delta covid variant contagion on the global economic recovery combined with the geopolitical risks kept the sentiment buoyed around the safe-haven gold.
Ahead of the Eurozone inflation data and the US CB Consumer Confidence on Tuesday, the US dollar is extending its post-Powell declines to refresh two-week lows, benefiting gold price. The market sentiment is mixed to cheerful, as the rest of Asia ex-China is in the green, tracking the record close on Wall Street. China stocks bear the brunt of the country’s slowing manufacturing sector activity while the services contract. Additionally, the dragon nation’s regulatory crackdown on private industries unnerves investors.
However, an uptick in the S&P 500 futures and a minor bounce in the Treasury yields is checking gold’s rebound for now. Looking ahead, gold price will remain at the mercy of the dynamics in the yields and the dollar. Meanwhile, gold price could resume the previous decline should the US CB Consumer Confidence disappoint markets big time and trigger a strong comeback in the safe-haven greenback.
Gold Price Chart - Technical outlook
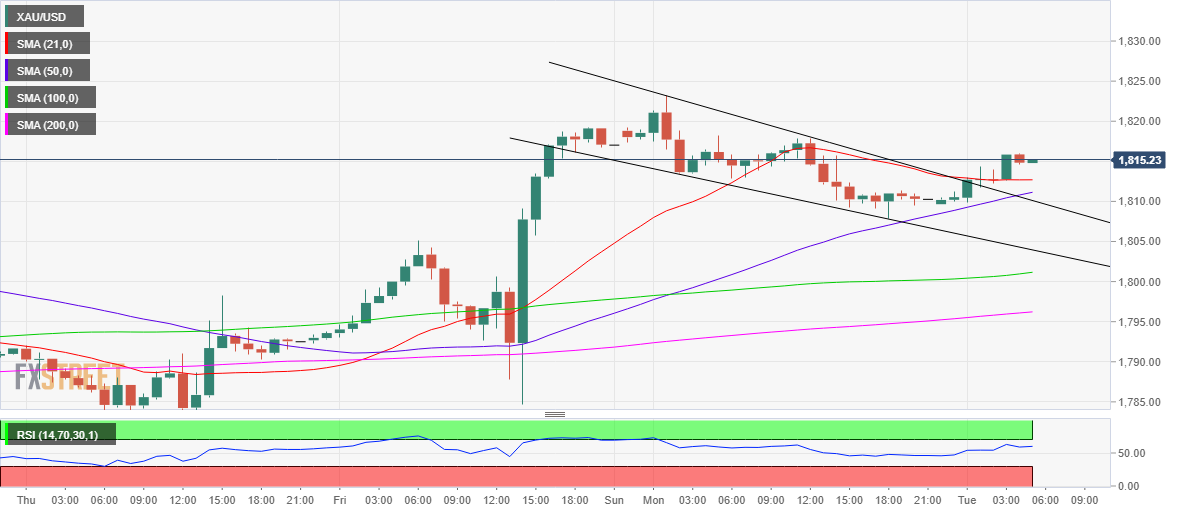
Gold: Hourly chart
The hourly chart shows that gold price remains on track to challenge $1830, especially after it confirmed a falling wedge formation on a sustained break above the hurdle at $1812.
In doing so, gold price has recaptured the horizontal 21-Hourly Moving Average (HMA), which aligns at the abovementioned level, forming strong support now.
Any retracement below the latter could challenge the wedge hurdle, now at $1810.
Further south, the wedge support at $1804 could come into play.
The Relative Strength Index (RSI) has turned lower but remains well above the midline, still keeping doors open for a fresh upswing.
Therefore, if the bulls regain poise, then Monday’s high at $1823 could challenge the renewed upside towards $1830.
Author

Dhwani Mehta
FXStreet
Residing in Mumbai (India), Dhwani is a Senior Analyst and Manager of the Asian session at FXStreet. She has over 10 years of experience in analyzing and covering the global financial markets, with specialization in Forex and commodities markets.


