Gold price forecast: Sellers defend bearish channel with shooting star
- Gold remains trapped in a bearish channel.
- Wednesday's bearish candle reinforced the negative crossover movign average cross confirmed last week.

Gold – a classic safe haven – is once again on the defensive, having failed to exit the bearish channel on Wednesday despite the re-escalation of the US-China trade tensions.
The metal did pick up a bid 24-hour ago and appeared on track to test the 100-day moving average (MA) at $1,295. The expected move higher, however, was cut short at the 50-day MA at $1,291.60. More importantly, the price fell all the way back below the day’s opening price of $1,284 and closed in the red at $1,279, forming a shooting star candlestick on the daily chart.
A shooting star indicates the sellers had a last laugh and so it is widely considered an early sign of bearish reversal if it appears following a significant price rally or at the key resistance.
The later seems to be the case here. As noted earlier, the metal faced rejection at the downward sloping (bearish0 50-day MA on Wednesday. Further, the shooting star has appeared closer to the falling channel resistance, as seen below.
Daily chart
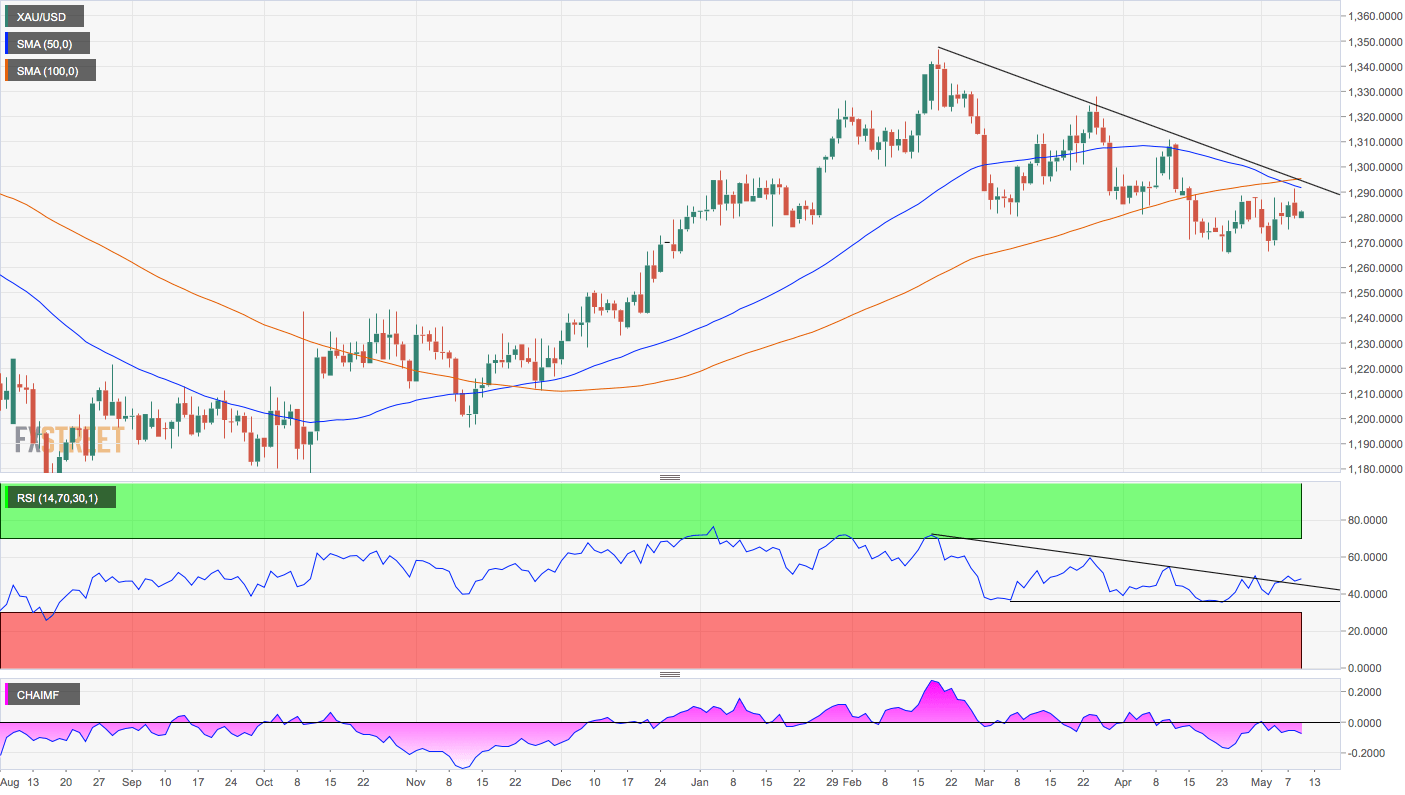
With the shooting star candle, the yellow metal has reinforced the bearish crossover of the 50-day and 100-day MAs confirmed last week. Further, that candle ensured the bearish channel remains intact.
As a result, the price could soon find acceptance below $1,279, confirming an end of the corrective bounce from the May 2 low of $1,266 signaled by Wednesday’s candle. Many traders tend to wait for a bearish follow-through to the shooting star in the form of a break below the low of that candle.
So, a break below $1,279 will likely invite stronger selling pressure, leading to a deeper sell-off toward the channel support at $1,260. Supporting the bearish case is the negative reading on the Chaikin money flow index. Also, It is worth noting that the ascending triangle breakout seen in the relative strength index (RSI) has been invalidated by price's rejection at the 50-day MA.
For the technical outlook to turn bullish, the price needs to close above the upper edge of the falling channel, currently at $1,292.
That could happen if the US-China trade tensions fade, allowing a sell-off in the US dollar. As of now, the greenback is solidly bid against most majors, especially against the Chinese yuan, against which it is trading at over four-four-month highs.
Markets are again treating the US Dollar as a safe haven, given the US has relatively less to lose from the trade war with the China and the US financial markets are backed by the Fed, which is always ready to press the dovish button, if required.
Author

Omkar Godbole
FXStreet Contributor
Omkar Godbole, editor and analyst, joined FXStreet after four years as a research analyst at several Indian brokerage companies.


