Gold Price Forecast: Risk-on weighs on the bright metal

XAU/USD Current price: $1,750.00
- Gold fell amid a better market mood sending investors into high-yielding assets.
- Central banks have confirmed they are in the tapering path, despite uncertainty persists.
- XAU/USD is technically bearish and could test March low at 1,676.73.
Gold is sharply down for a second consecutive day, trading in the 1,750 price zone. Risk appetite took over financial markets on Thursday, following news that the Chinese Evergrande company will likely be split into three separate entities to prevent its default and financial disruption in the country. The greenback edged lower across the board but also did the safe-haven metal.
Most European indexes closed in the green, while Wall Street posted substantial gains, turning green for the week. Meanwhile, the yield on the 10-year US Treasury note jumped to 1.41%, its highest level since last July, a sign of the risk-on mood.
On Wednesday, the US Federal Reserve noted that economic progress in the US gives the central bank the chance to retrieve part of its massive financial support. “If progress continues broadly as expected, the Committee judges that a moderation in the pace of asset purchases may soon be warranted,” the statement read. On Thursday, the Bank of England had a monetary policy and pointed out better economic conditions opening the door for a tighter monetary policy.
Gold price short-term technical outlook
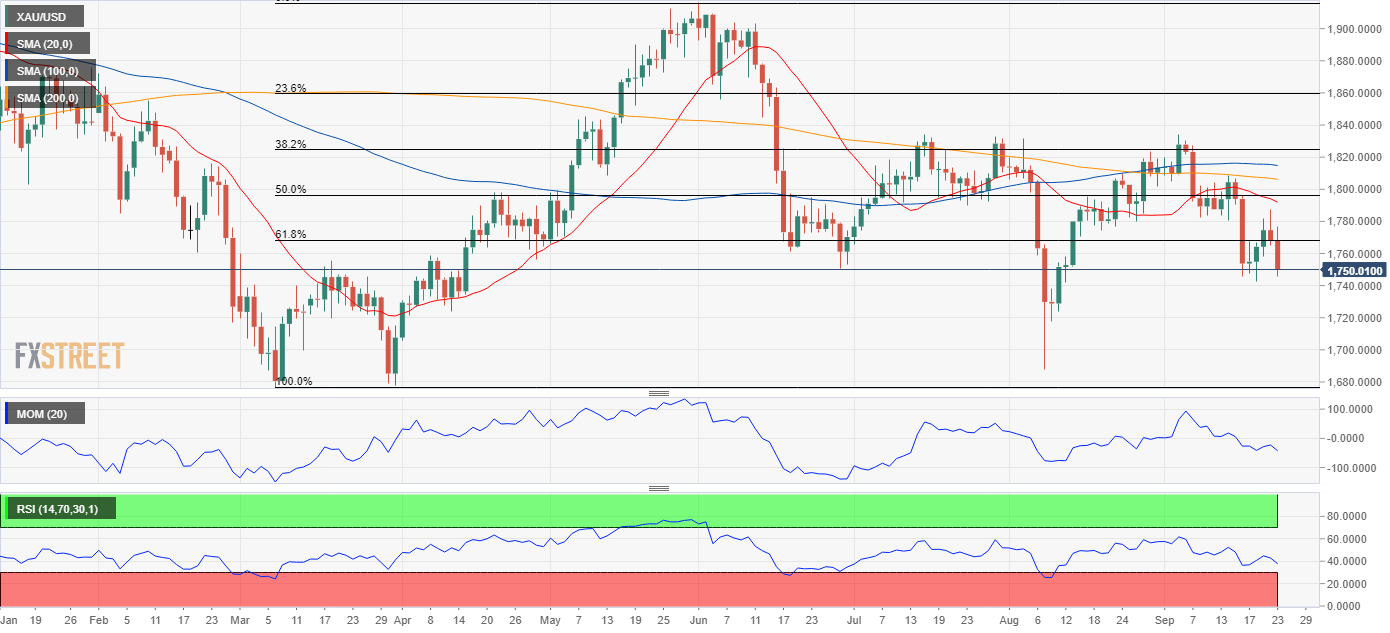
XAU/USD trades near its September low at $1,742.00 a troy ounce, the immediate support level. It is also below the 61.8% retracement of its March/June rally at 1,769.10, a critical resistance level. Should the pair break below the mentioned monthly low, it has room to test the lower end of the range at 1,676.73.
The daily chart shows that gold is well below all of its moving averages, with the 20 SMA accelerating south below the longer ones. Moreover, technical indicators have accelerated their declines within negative levels, maintaining their strong bearish momentum.
In the near term, and according to the 4-hour chart, the risk is also skewed to the downside. The 20 SMA converges with a Fibonacci resistance turning lower below the longer ones, while technical indicators remain near their daily lows well into negative territory.
Support levels: 1,742.00 1,734.30 1,725.10
Resistance levels: 1,769.10 1,785.40 1,796.90
Premium
You have reached your limit of 3 free articles for this month.
Start your subscription and get access to all our original articles.
Author

Valeria Bednarik
FXStreet
Valeria Bednarik was born and lives in Buenos Aires, Argentina. Her passion for math and numbers pushed her into studying economics in her younger years.


