Gold Price Forecast: On its way to challenge sellers around $2,000


XAU/USD Current price: $1,988.51
- US Manufacturing PMI contracted for a fifth consecutive month in March.
- Inflation-related concerns provided temporal support to the US Dollar at the beginning of the day.
- XAU/USD positive momentum likely to result in a test of the psychological $2,000 threshold.
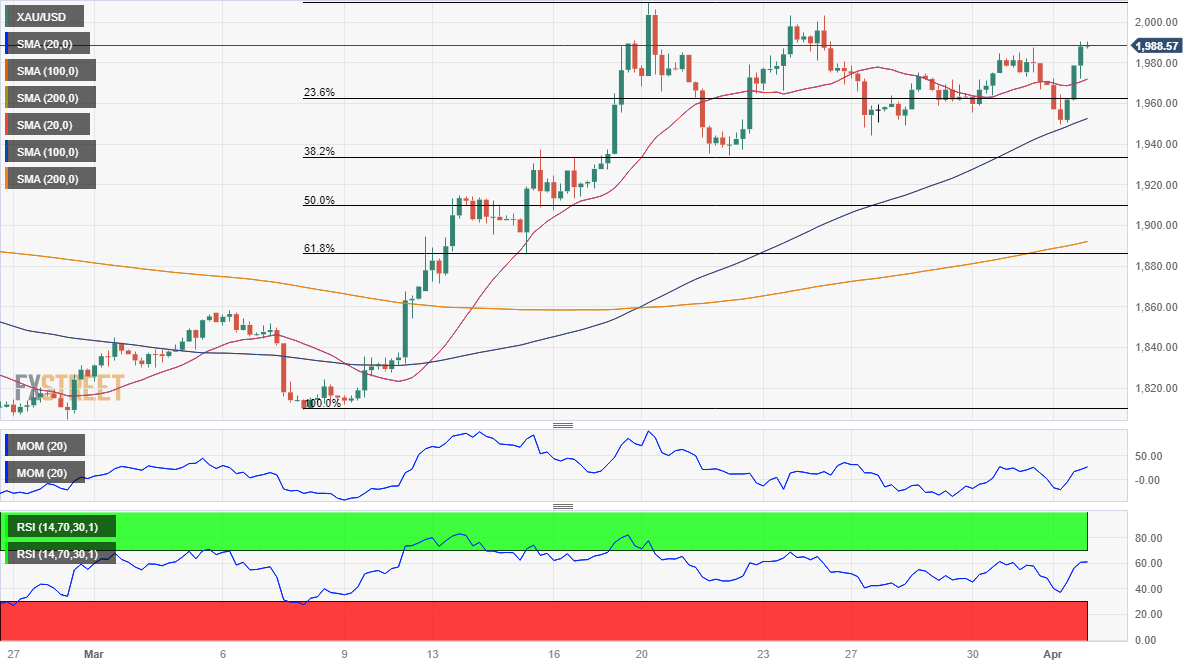
Spot gold bounced sharply from an intraday low of $1,949.70, and it’s on its way to challenging the $2,000 threshold. Financial markets started the week in risk-averse mode rushing into the US Dollar. Concerns were triggered by the unexpected OPEC+ decision to cut oil output by roughly 1.16 million barrels per day. Government bond yields soared amid renewed inflation-related concerns, reflecting investors’ run to safety.
The mood improved ahead of London’s opening as Asian indexes trimmed losses while European ones advanced. Government bond yields retreated, and the US Dollar came under selling pressure. The Greenback fell further after the release of dismal United States data, as the March ISM Manufacturing PMI contracted by more than expected, falling to 46.3, down for a fifth consecutive month and at its lowest in over two years. Wall Street, on the other hand, trades mixed, with only the Dow Jones Industrial Average holding on to modest gains.
XAU/USD price short-term technical outlook
The daily chart for the XAU/USD pair shows that buyers are in full control. The bright metal gapped higher at the weekly opening and soared after a short-lived pullback, now hovering around the $1,990 level. Technical indicators regained the upside within positive levels and after correcting overbought conditions. At the same time, the 20 Simple Moving Average (SMA) advanced further above the longer ones, all of them with strong upward slopes.
In the near term, and according to the 4-hour chart, the risk is skewed to the upside as technical indicators extend their advances and point higher within positive levels, reflecting bulls’ strength, while the metal develops above all its moving averages. The 20 SMA remains neutral at around $1,971, providing interim support, while the longer ones head firmly north below it. The pair hit a multi-month high of $2,009.11 in mid-March, with buyers likely to test bears’ determination around that level in the upcoming sessions.
Support levels: 1.971.00 1,962.30 1,947.50
Resistance levels:1,998.40 2,010.00 2,022.90
Author
Valeria Bednarik
FXStreet
Valeria Bednarik was born and lives in Buenos Aires, Argentina. Her passion for math and numbers pushed her into studying economics in her younger years.