Gold Price Forecast: Eyes $1,240 after fresh 2018 low
- Gold fell to fresh 2018 low of $1,275 today.
- Persistent bull failure seems to have opened the floodgates for sell-off to $1,240.

Gold (XAU/USD) fell sharply to a fresh 2018 low of $1,275 today and could drop further to $1,240 in a week or two, the technical charts indicate.
Weekly chart
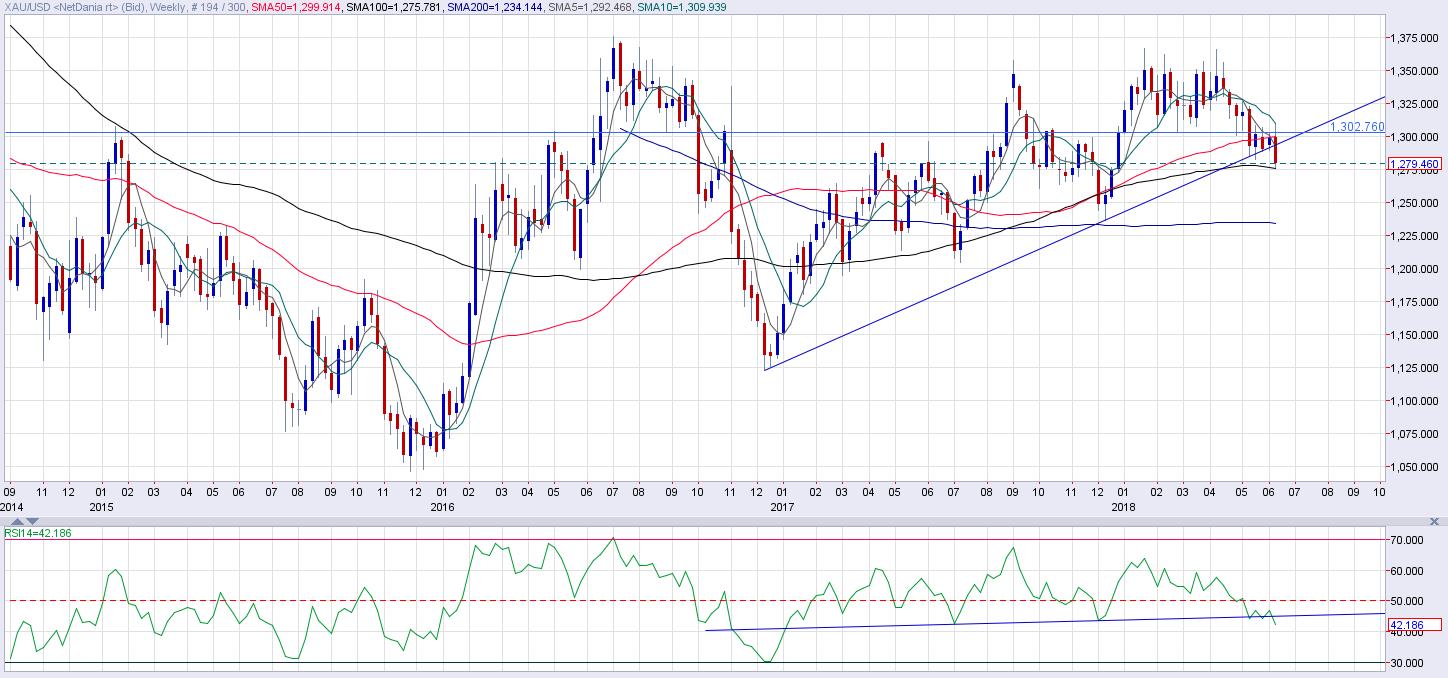
Chart Source: Netstation
The above chart shows:
- The yellow metal ended the second week of May below $1,302.76 (double top neckline), confirming a bearish reversal/double top breakdown and opening doors for $1,240 (target as per the measured height method).
- The ensuing sell-off ran out of steam around the ascending trendline (drawn from the December 2016 low and December 2017 low) in the third week of May and prices rose back to $1,300, as expected.
- The metal peeped above the neckline resistance (former support) in the last two weeks, with trendline acting as a strong support, but failed to scale the key level on a weekly closing basis.
- What's more, the yellow metal jumped above the 200-day moving average of $1,308 this week, but quickly fell back below $1,302.76 (neckline).
Also, it is worth noting that metal repeatedly failed to secure a weekly close above $1,302 despite:
- Repeated rebound from the long-term rising trendline support (as seen in the weekly chart above)
- An upside break of the falling wedge (bullish reversal pattern) on June 5 (as seen in the daily chart)
- Italian political crisis and the resulting risk aversion in the global markets, escalating trade tensions.
So, bears were expected to seize control sooner or later. Hence, a drop to $1,275 does not come as a surprise and only bolsters the already bearish technical setup-
- Double top breakdown.
- Bulls' inability to scale $1,302.76 on a weekly closing basis.
- Break below the long-term ascending trendline.
- Downward sloping (bearish) 5-week and 10-week moving averages.
- Bearish crossover between 5-week and 50-week moving average.
- Head-and-shoulders breakdown on the 14-week relative strength index (RSI).
View
Gold will likely drop to $1,240 in a week or two. Only a weekly close above $1,302.76 would abort the bearish view.
Author

Omkar Godbole
FXStreet Contributor
Omkar Godbole, editor and analyst, joined FXStreet after four years as a research analyst at several Indian brokerage companies.
More from Omkar Godbole


