Gold Price Forecast: Corrective rally is encouraging but downside still calling
- Gold has a relook at double top neckline, could be crowding out weak bears.
- The long-term outlook remains bearish.

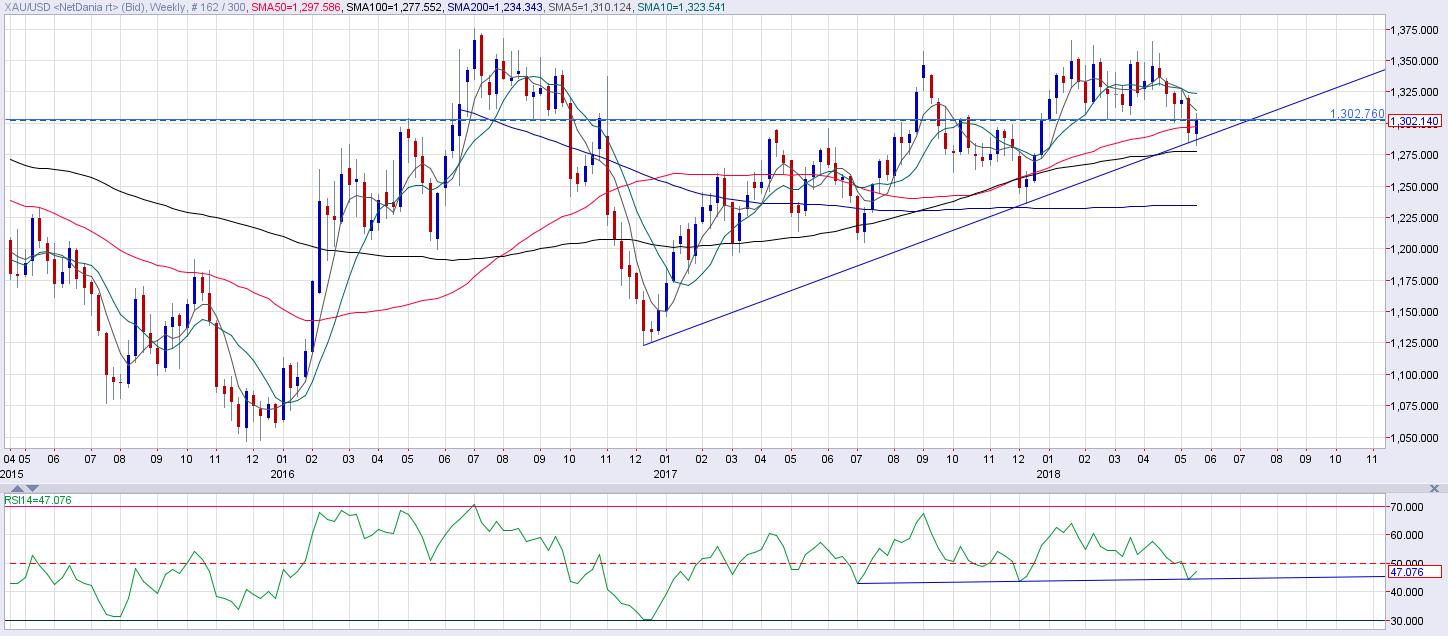
Gold defended a key rising trendline support and revisited the double top neckline level of $1,302 this week as expected,
Currently, the yellow metal is trading at $1,303, having clocked a weekly high and low of $1,307.80 and $1,282.01, respectively. The recovery from $1,282 is encouraging, still, it is too early to call a bullish trend reversal.
Downside still calling
Weekly chart

The chart shows the corrective rally seems to have run out of steam around the double top neckline level of $1,302. Moreover, this could be a bull trap as markets tend to crowd out weak hands (bears in gold's case) following a major bearish (or bullish) breakdown. So, gold may have shaken out weak bears this week by having a re-look at levels above the neckline and could resume the sell-off next week.
The descending 5-week and 10-week moving averages (MAs) continue to favor the bears. Further, the corrective rally from the weekly low of $1,302 has failed to cut through $1,308.6 - 23.6 percent Fibonacci retracement of Dec 2016 - Jan 2018 rally.
Also, the metal is trapped inside a falling channel, as seen in the chart below.
Daily chart
-636628733759391348.png)
Short-term view (next week)
The metal will likely revisit $1,282. The bear case will strengthen if gold bulls are unable to penetrate the falling channel hurdle on Monday and Tuesday. Meanwhile, a bullish falling channel breakout would shift risk in favor of a rally to $1,315-$1,320.
Bearish invalidation: A daily close above the 200-day MA located at $1,308 would abort the bearish view.
Bullish reversal: A close above $1,325 would confirm a short-term bear-to-bull trend change and would allow re-test of the all-important resistance of 100-month MA, currently located at $1,352.
Long-term view: Gold could drop to $1,240
Monthly chart
The repeated failure to beat the 100-month MA in a convincing manner, despite the large bullish RSI divergence (from mid-2013 to end 2015) could have weakened the bulls. This, coupled with the double top reversal (seen in the weekly chart), indicates the metal will likely drop to $1,240 (double top neckline target) - $1,236 (50-month MA) in the next couple of months.
Only a monthly close above the 100-month MA, currently seen at $$1,352, would signal a resumption of the rally from the December 2015 low of $1,046 and would open up upside towards $1,500.
Author

Omkar Godbole
FXStreet Contributor
Omkar Godbole, editor and analyst, joined FXStreet after four years as a research analyst at several Indian brokerage companies.


