Gold Price Forecast: Charts lower high ahead of US Nonfarm Payrolls
- Gold is looking heavy, having charted a bearish lower high at $1,536.
- The metal will likely take a hit if the US data beats estimates.
- Key support is seen at $1,483 and resistance at $1,536 is the level to beat for the bulls.

Gold could post losses below a widely followed support next week, having charted a bearish lower high this week.
The yellow metal picked up a bid on Monday, as expected, and rose to a high of $1,536 on Tuesday. The bid tone, however, weakened as the week progressed with prices falling back to $1,500.
As of writing, Gold is trading around $1,500 per Oz, representing a 1.21% drop on a weekly basis. Prices hit a low of $1,487.10 earlier today.
The recovery could be associated with the reports stating that the Trump administration is considering reducing investment into China and may force exchanges to delist Chinese companies as a part of trade retaliation.
While the recovery is impressive, the safe-haven metal is still on track to post a weekly loss, which is not surprising as the Dollar Index, which tracks the value of the greenback against majors, is set to end the week with 0.66% gains. The American Dollar is Gold’s biggest nemesis.
Looking forward
Gold may draw haven demand if the US-China trade tensions escalate. The gains, however, could be short-lived as US Treasuries will likely attract haven demand as well, strengthening the bid tone around the US Dollar.
Apart from the trade tensions, the focus will be on the monthly Purchasing Managers’ Indices (PMIs), German Consumer Price Index and the US Nonfarm Payrolls data.
Markets may turn risk-averse, sending Gold higher if China’s PMI numbers bolster fears of a deeper economic slowdown. Also, the US dollar may strengthen, capping the upside in Gold if the preliminary German inflation data prints below estimates, validating the European Central Bank’s (ECB) rate decision.
That said, the main event is next Friday’s Payrolls data, which is expected to show the US economy added 140K jobs in September following a 130K addition in August. Meanwhile, the jobless rate is expected to remain steady at 3.7 per cent and the Average Hourly Earnings are seen rising 0.3% month-on-month.
The Federal Reserve (Fed) cut rates earlier this month, as expected, but policymakers were split on the need for more easing in the near term. The hawkish cut convinced many that the central bank would stand pat for the rest of the year.
That belief would be reinforced, leading to a Dollar rally and a sell-off in Gold, if the payrolls and the wage growth data beat estimates.
Technical outlook
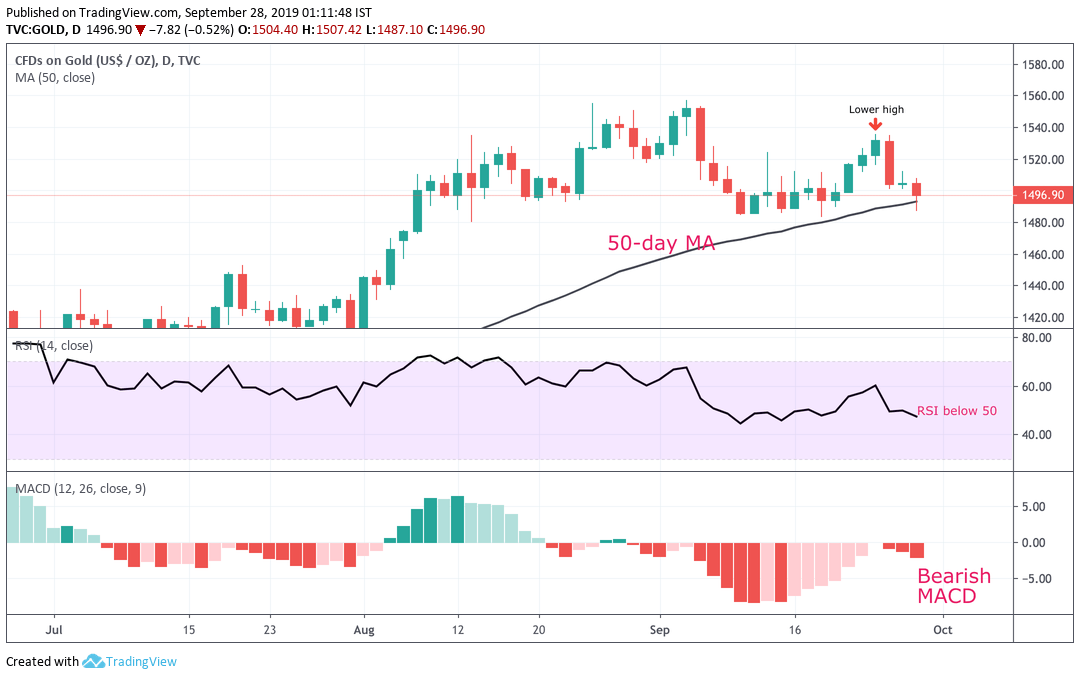
Gold has tested the 50-day moving average from the first time since the end of May. The average is currently located at $1,493.
The daily chart shows a lower high has been established at $1,536. A bearish reversal would be confirmed if and when prices confirm a lower low below Sept. 18’s low of $1,483.
That could happen next week, as the key indicators are beginning to roll over in favor of the bears. For instance, the 14-day relative strength index (RSI) has dipped below 50 (bearish territory). The MACD histogram is also reporting bearish conditions with a below-zero print.
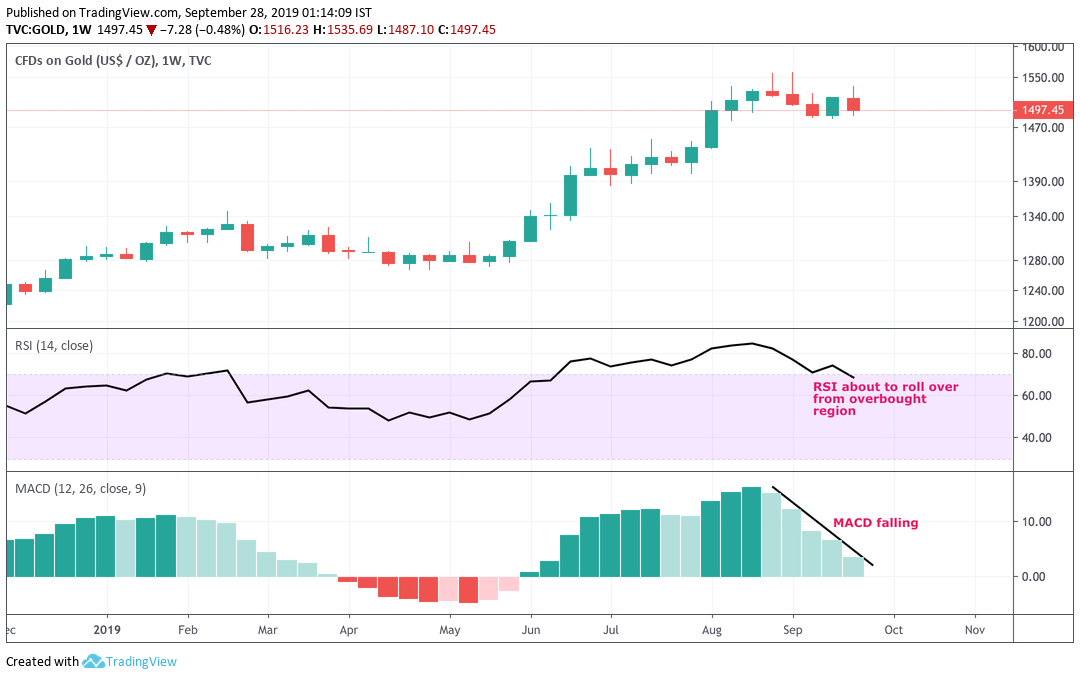
On the weekly chart, the MACD histogram is about to cross below zero, confirming a bullish-to-bearish trend change, and the RSI has turned lower from above-70 levels, signalling scope for a deeper correction.
All in all, the probability of the metal breaching the 50-day MA support at $1,493 and challenging recent lows near $1,483 next week are high.
The technical outlook would turn bullish if prices rise above $1,436, invalidating the bearish lower-highs setup on the daily chart. That level may come into play if the 50-day MA holds ground in the first half of the next week.
Daily chart
Weekly chart
Forecasts
Author

Omkar Godbole
FXStreet Contributor
Omkar Godbole, editor and analyst, joined FXStreet after four years as a research analyst at several Indian brokerage companies.


