XAU/USD Current price: $1,859.43
- Chinese news continue to lead the market’s sentiment, spurring optimism on Wednesday.
- Easing government bond yields worldwide undermined demand for the US Dollar.
- XAU/USD recovered its firmly bullish stance and could storm through $1,878.91, the June high.
Spot gold resumed its advance and traded as high as $1,865.12 a troy ounce, a level that was last seen early in June 2022. The US Dollar came under selling pressure during Asian trading hours, giving up all of Tuesday’s gains and even falling to fresh weekly lows, mainly against commodity-linked currencies.
Market players are still looking at China for direction. Optimism about a potential economic comeback, despite the fact it would not be easy or fast, fueled demand for high-yielding assets. The initial catalyst came from market talks suggesting the world’s second-largest economy will resume importing coal from Australia after banning the import of multiple goods from the country in the early stages of the coronavirus pandemic.
Global government bond yields are on the back foot, with the US Treasury yield down roughly 10 bps. Financial markets entered wait-and-see mode ahead of the upcoming FOMC Meeting Minutes. The United States Federal Reserve (Fed) will provide clearer clues on why policymakers decided to upwardly revise their inflation forecasts, alongside what they plan next on monetary policies.
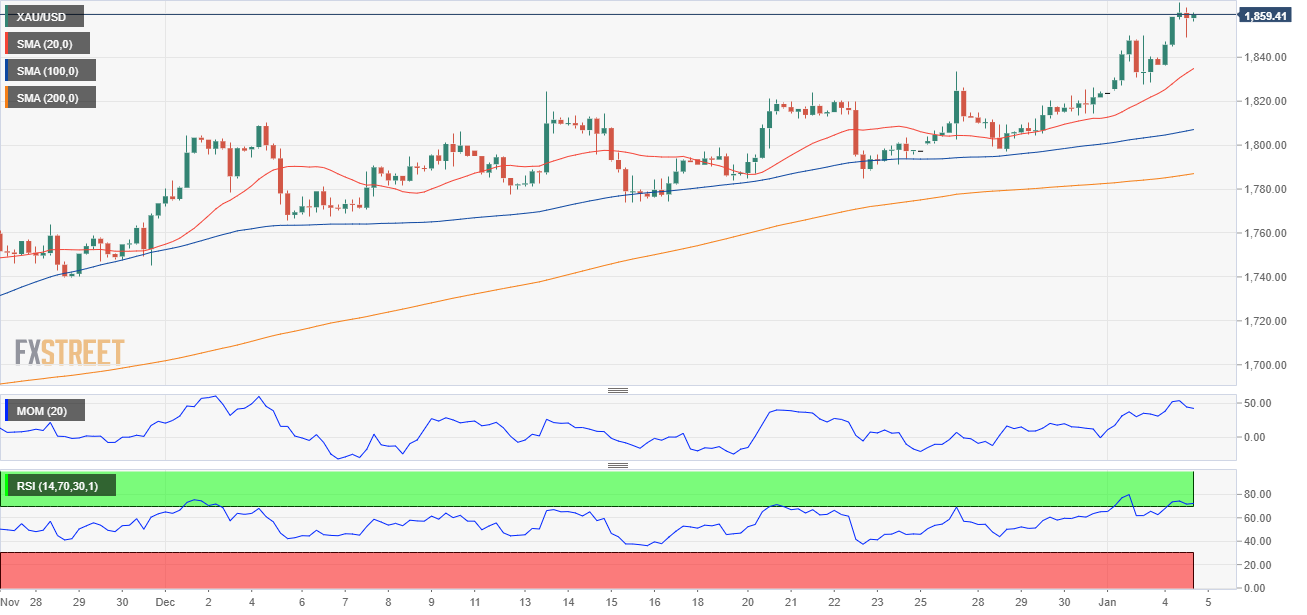
XAU/USD price short-term technical outlook
The daily chart for XAU/USD shows that it is up for a fourth consecutive day, with a firmly bullish stance. The pair is developing well above its moving averages, with the 20 Simple Moving Average (SMA) accelerating north above the longer ones. At the same time, the Momentum indicator hovers directionless above its midline, while the Relative Strength Index (RSI) heads firmly north at around 67, in line with another leg higher.
In the near term, and according to the 4-hour chart, gold is overbought but without giving signs of upward exhaustion. XAU/USD trades far above bullish moving averages, while technical indicators ticked higher but overall consolidate at extreme levels. The bright metal would need to overcome $1,865.15 to gain traction enough to test the $1,900 threshold.
Support levels: 1,819.30 1,806.70 1,793.10
Resistance levels: 1,865.15 1,878.90 1,890.50
Information on these pages contains forward-looking statements that involve risks and uncertainties. Markets and instruments profiled on this page are for informational purposes only and should not in any way come across as a recommendation to buy or sell in these assets. You should do your own thorough research before making any investment decisions. FXStreet does not in any way guarantee that this information is free from mistakes, errors, or material misstatements. It also does not guarantee that this information is of a timely nature. Investing in Open Markets involves a great deal of risk, including the loss of all or a portion of your investment, as well as emotional distress. All risks, losses and costs associated with investing, including total loss of principal, are your responsibility. The views and opinions expressed in this article are those of the authors and do not necessarily reflect the official policy or position of FXStreet nor its advertisers. The author will not be held responsible for information that is found at the end of links posted on this page.
If not otherwise explicitly mentioned in the body of the article, at the time of writing, the author has no position in any stock mentioned in this article and no business relationship with any company mentioned. The author has not received compensation for writing this article, other than from FXStreet.
FXStreet and the author do not provide personalized recommendations. The author makes no representations as to the accuracy, completeness, or suitability of this information. FXStreet and the author will not be liable for any errors, omissions or any losses, injuries or damages arising from this information and its display or use. Errors and omissions excepted.
The author and FXStreet are not registered investment advisors and nothing in this article is intended to be investment advice.
Recommended Content
Editors’ Picks
EUR/USD finds support above 1.0450, holds at 10-month lows

EUR/USD dropped to a fresh low for the year, reaching a level close to 1.0450 on Tuesday. It then experienced a slight rebound, but recovery momentum faded around 1.0480. The US Dollar continues to be supported by positive US economic data, higher yields, and a risk-averse market sentiment.
GBP/USD moving sideways around 1.2070

GBP/USD reached a bottom at 1.2053 on Tuesday, marking the lowest level since March. However, it later trimmed its losses and rebounded to 1.2100. Nevertheless, the pair pulled back once again following positive US data. It is stabilizing around 1.2070.
Gold moves closer to $1,800 amid risk-off flows Premium

Gold price stays under modest bearish pressure and trades below $1,830 in the second half of the day on Tuesday. The benchmark 10-year US Treasury bond yield holds at fresh multi-year highs above 4.7% after upbeat US data, not allowing XAU/USD to gain traction.
Bitcoin Lightning Network capacity falling to a 14-month low should not worry BTC investors

Before Bitcoin Ordinals and BRC-20, the world’s first cryptocurrency network ran the most prominent Layer-2 solution – Lightning Network (LN). Over the past, the network was widely utilized for conducting faster transactions, but LN seems to be losing the amount of BTC on it at the moment.
S&P 500 Forecast: Index slides over 1% as risk-off mood persists

The S&P 500 index lost 0.74% last week, which was the fourth week in a row where the index declined. That performance came despite Personal Consumption Expenditures (PCE) data showing that Core inflation was growing at its slowest pace in two years.