Gold Price Forecast: Bulls hold the grip, but for now, stay in the side-lines

XAU/USD Current price: $1,850.51
- Market players await the outcome of multiple first-tier events scheduled throughout this week.
- A better market mood, despite sour news from China, keeps investors away from safe-haven assets.
- XAU/USD consolidates around $1,850, with the risk skewed to the upside.
Spot gold trades at around $1,850 a troy ounce, little changed at the beginning of the week. The bright metal peaked at $1,858.28 during Asian trading hours, its highest in over two weeks as broad US Dollar weakness from last Friday extended. The USD saw some temporal demand during London trading hours but resumed its decline after Wall Street’s opening.
Nevertheless, risk appetite is keeping investors away from safe-haven gold. Stock markets trade in the green, shrugging off some negative headlines coming from China that temporarily affected the market mood. The Asian giant has set an official economic growth target of “around 5%” for this year at the annual gathering of the National People’s Congress (NPC). The figure was softer than anticipated as the country struggles to revive the economy in the post-pandemic era.
US government bond yields retreated from last week’s high, further pressuring the US Dollar. The yield on the 10-year Treasury note slid to 3.89%, to later trim losses and currently hover around 3.96%. The 2-year note currently offers 4.88%, up 2 bps for the day.
XAU/USD stays relatively quiet ahead of several first-tier events scheduled for later this week. United States Federal Reserve Chair Jerome Powell will testify on the Semi-Annual Monetary Policy Report before the Senate Banking Committee on Tuesday. The Reserve Bank of Australia, the Bank of Canada and the Bank of Japan will announce their monetary policy decisions throughout the week, while on Friday, the US will publish the February Nonfarm Payrolls report.
XAU/USD price short-term technical outlook
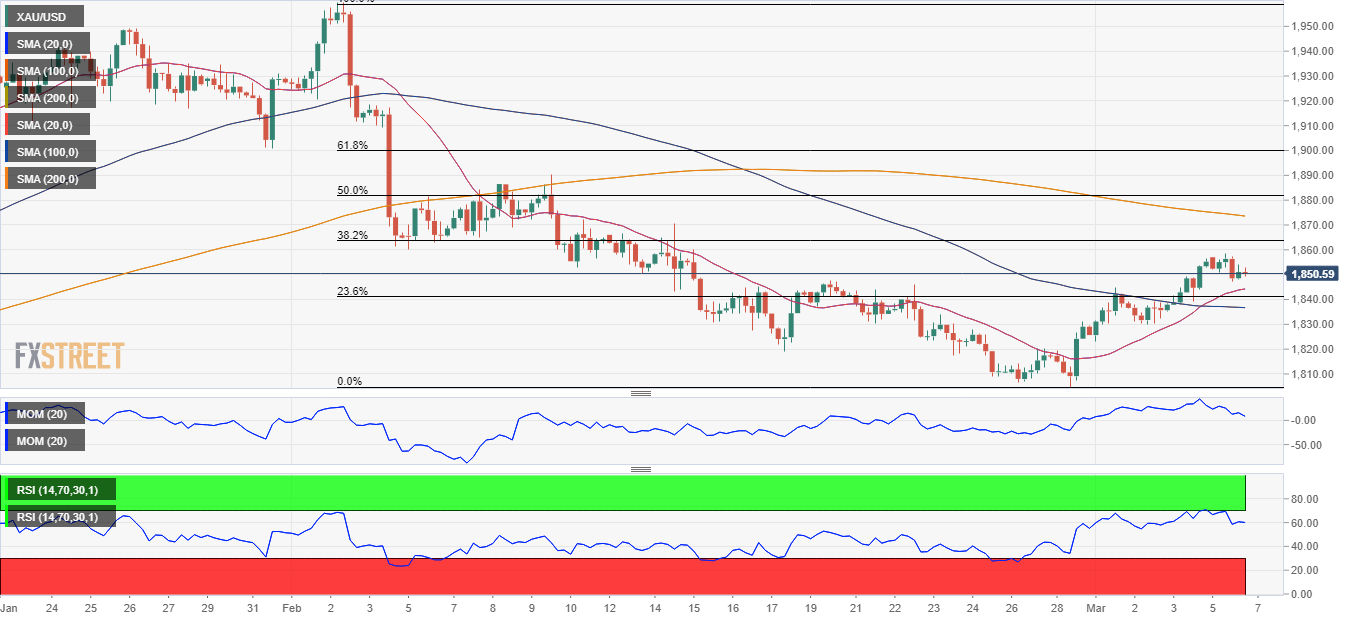
XAU/USD trades above a Fibonacci support level, the 23.6% retracement of the $1,959.75/$1,804.70 decline at $1,841.04. The daily chart offers a neutral-to-bullish stance, as the pair is currently developing above its moving averages. The 100 Simple Moving Average (SMA) heads north well below the current level, but the 20 SMA is mildly bearish at around the aforementioned Fibonacci support. Technical indicators, in the meantime, are stuck around their midlines, failing to provide directional clues.
The 4-hour chart offers a similar picture for the near term. The pair is holding above the 20 and 100 SMAs, with the shorter advancing above the longer ones. Technical indicators remain directionless, although within positive levels, reflecting the absence of selling interest. A critical resistance level is at $1,863.70, the 38.2% retracement of the mentioned decline. Bulls will likely push towards $1,900 once above the latter.
Support levels: 1,841.04 1,825.90 1,812.20
Resistance levels: 1,863.70 1,877.50 1,889.10
Premium
You have reached your limit of 3 free articles for this month.
Start your subscription and get access to all our original articles.
Author

Valeria Bednarik
FXStreet
Valeria Bednarik was born and lives in Buenos Aires, Argentina. Her passion for math and numbers pushed her into studying economics in her younger years.


