Gold Price Forecast: Bearish bias intact, but 'death cross' confirmation could yield minor corrective rally
- The gold daily chart shows death cross - a bearish crossover between the 50-day and 200-day moving average (MA) - which is often used as a contrarian technique for short-term trading.
- So, a minor corrective rally could be on the cards.
- Broader outlook remains bearish, the metal looks set to test $1,240-$1,235.

Daily chart
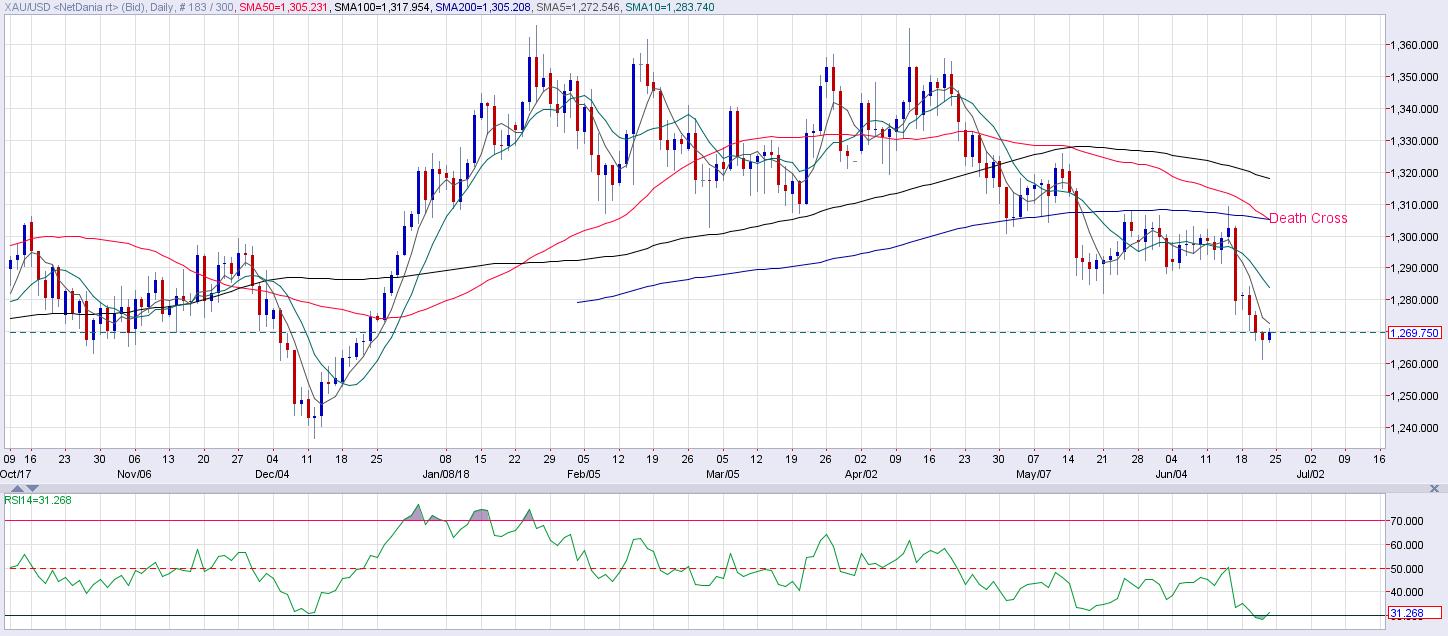
Chart source: Netstation
Gold will likely drop to $1,240-$1,235 in a couple of weeks, albeit after a minor corrective rally, the technical studies indicate.
As of writing, the yellow metal is changing hands at $1,270/Oz, having hit a six-month low of $1,261 yesterday. The sell-off from the April high of $1,366 to $1,261 has pushed the 50-day moving average below the 200-day moving average. The crossover, popularly known as death cross, is a long-term bearish indicator but tends to work as a contrarian study in the short-term.
This is because the bears have to put in a great effort to push the 50-day MA below the 200-day MA. So, the asset usually shows short-term oversold conditions at the time of actual crossover.
The zero-yielding safe haven yellow metal does look oversold as per the 14-day relative strength index (RSI). Hence, a minor corrective could be on the cards next week despite the death cross.
That said, the metal may have a tough time scaling the immediate resistance of $1,282 (May 21 low) in a convincing manner as the 5-day and 10-day MA are trending south, indicating a bearish setup.
Further, the long-duration technical charts are also aligned in favor of the bears.
Weekly chart
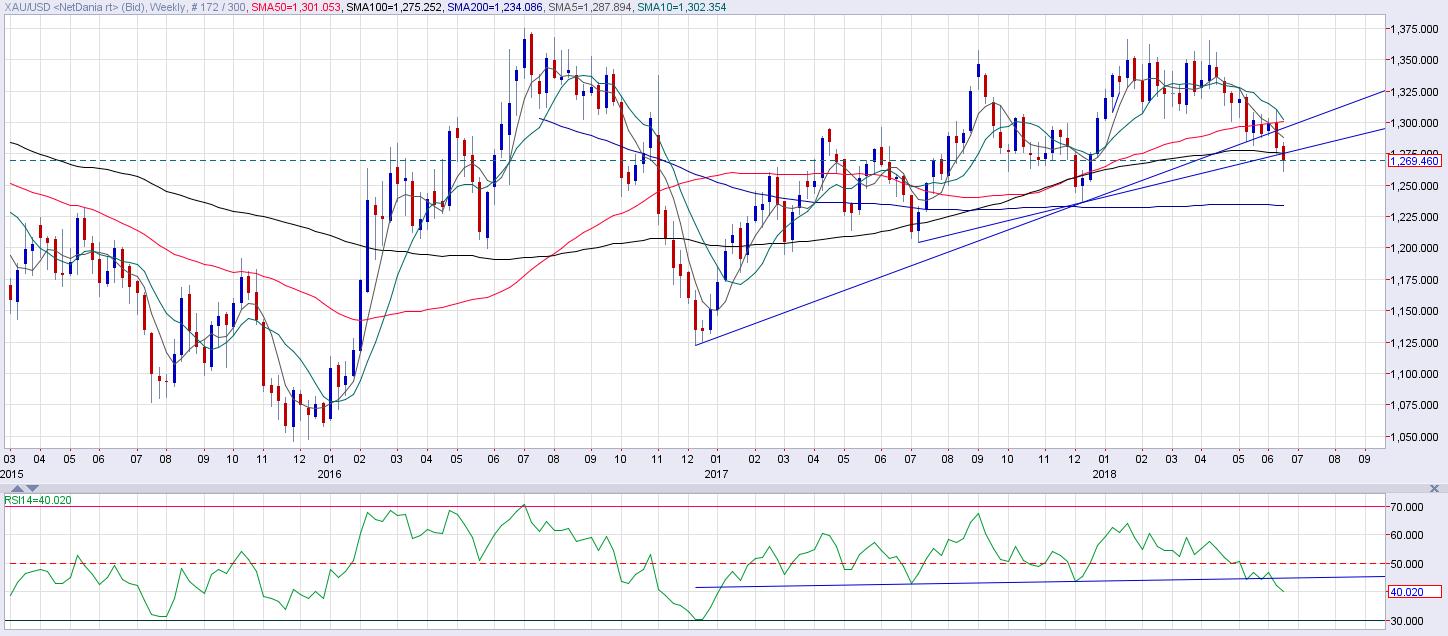
Chart source: Netstation
The metal has taken out support of the key ascending trendline drawn from July 2017 low and December 2017 low, bolstering the already bearish technical setup - double top breakdown, a break below the rising trendline (drawn from December 2016 low and December 2017 low) and the bearish (downward sloping 5-week MA and 10-week MA.
Further, gold has found acceptance below the 50-week MA and 100-week MA. Meanwhile, the 10-week MA is seen crossing the 50-week MA in a gold-negative manner. And last but not the least, the 14-week relative strength index shows a head-and-shoulders breakdown (bearish setup). Clearly, the bears are in control here.
View
The death cross confirmation could yield a minor corrective rally to $1,282-$1,285 range. However, further gains are ruled out as the long-run charts are biased to the bears and the metal looks set to test $1,240 (double top breakdown target) and $1,235 (confluence of 200-week MA, 50-month MA and ascending trendline drawn from December 2015 low and December 2016 low).
Only a weekly close above $1,302.76 (double top neckline support-turned-resistance) would abort the bearish view.
Author

Omkar Godbole
FXStreet Contributor
Omkar Godbole, editor and analyst, joined FXStreet after four years as a research analyst at several Indian brokerage companies.


