Gold Price Forecast: A visit to the record high might be delayed
- Gold prices halted a multi-day positive streak after hitting $3,440.
- The US Dollar retreated marginally as traders assessed the US-Japan deal.
- A potential US-EU trade agreement now appears closer, according to discussions.

Gold prices reversed a three-day positive streak on Wednesday, facing increasing selling pressure soon after reaching fresh five-week tops around the $3,440 mark per troy ounce.
The precious metal’s pullback followed a modest retreat in the US dollar and a decent rebound in US yields across the curve, all stemming from an improved trade backdrop after the US‑Japan agreement. Under the deal, Japan will cut tariffs on US‑made cars and refrain from imposing additional taxes on other goods in exchange for $550 billion in US‑bound investment and loans.
Also weighing on the yellow metal, diplomats now see further progress toward a trade agreement between the United States and the European Union (EU), which could include a 15% tariff deal.
Persistent pressure on the greenback was also fuelled by another round of Trump's anti-Powell rhetoric, in which he implied that Chair Powell "will be out soon." Still on the matter, US Treasury Secretary Scott Bessent said on Tuesday that Powell did not need to depart right now.
Moving ahead, investors are likely to carefully monitor advanced indicators of US and worldwide business activity on Thursday, as well as the weekly report on the US labour market.
Gold’s short-term technical outlook
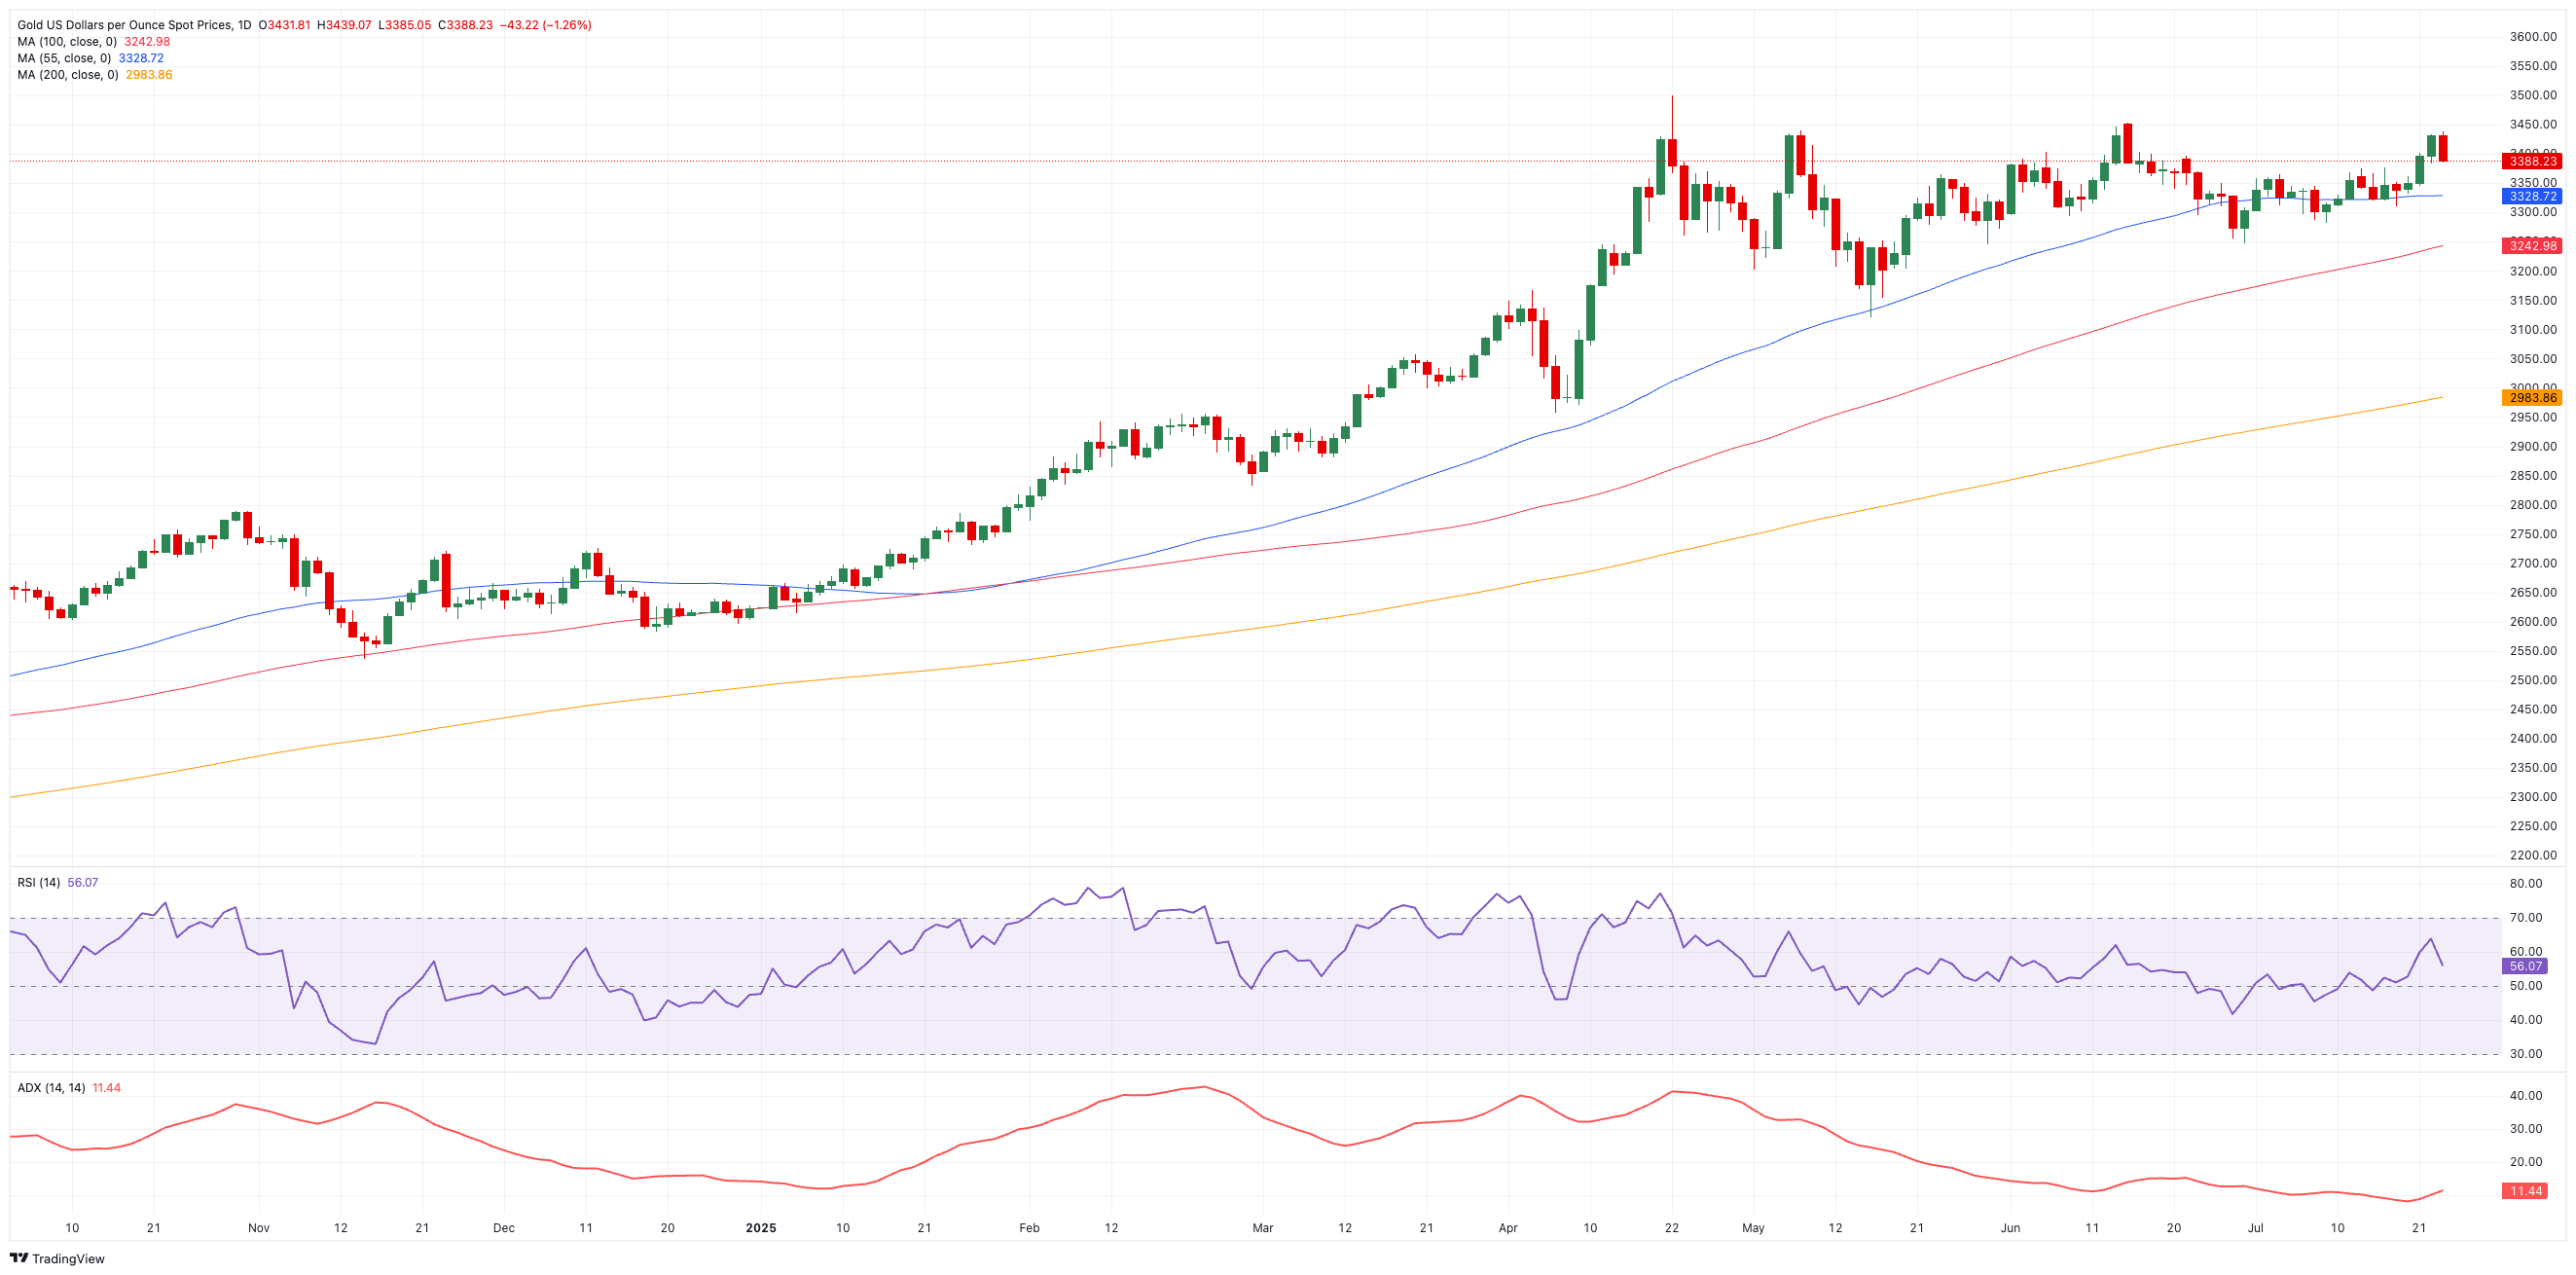
Further advances may see the June high of $3,451 (June 16) retested, ahead of the record top of $3,500 (April 22) and Fibonacci extensions of the 2024-2025 rise at $3,912 and $4,127.
If sellers take control, the loss of the June trough at $3,244 (June 30) may result in a test of the intermediate 100-day SMA at $3,243. This region is also supported by the 78.6% Fibonacci retracement of the 2024-2025 surge. From here, the May base shows as $3,120 (May 15).
Momentum indicators are optimistic. The Relative Strength Index (RSI) remains above 56, although an Average Directional Index (ADX) of approximately 11 indicates a deteriorating trend.
XAU/USD daily chart
Gold FAQs
Gold has played a key role in human’s history as it has been widely used as a store of value and medium of exchange. Currently, apart from its shine and usage for jewelry, the precious metal is widely seen as a safe-haven asset, meaning that it is considered a good investment during turbulent times. Gold is also widely seen as a hedge against inflation and against depreciating currencies as it doesn’t rely on any specific issuer or government.
Central banks are the biggest Gold holders. In their aim to support their currencies in turbulent times, central banks tend to diversify their reserves and buy Gold to improve the perceived strength of the economy and the currency. High Gold reserves can be a source of trust for a country’s solvency. Central banks added 1,136 tonnes of Gold worth around $70 billion to their reserves in 2022, according to data from the World Gold Council. This is the highest yearly purchase since records began. Central banks from emerging economies such as China, India and Turkey are quickly increasing their Gold reserves.
Gold has an inverse correlation with the US Dollar and US Treasuries, which are both major reserve and safe-haven assets. When the Dollar depreciates, Gold tends to rise, enabling investors and central banks to diversify their assets in turbulent times. Gold is also inversely correlated with risk assets. A rally in the stock market tends to weaken Gold price, while sell-offs in riskier markets tend to favor the precious metal.
The price can move due to a wide range of factors. Geopolitical instability or fears of a deep recession can quickly make Gold price escalate due to its safe-haven status. As a yield-less asset, Gold tends to rise with lower interest rates, while higher cost of money usually weighs down on the yellow metal. Still, most moves depend on how the US Dollar (USD) behaves as the asset is priced in dollars (XAU/USD). A strong Dollar tends to keep the price of Gold controlled, whereas a weaker Dollar is likely to push Gold prices up.
Author

Pablo Piovano
FXStreet
Born and bred in Argentina, Pablo has been carrying on with his passion for FX markets and trading since his first college years.