Gold price consolidates amid Fed rate cut uncertainty and lack of drivers
-
Gold prices are consolidating due to a lack of new fundamental or technical drivers.
-
Historical patterns show that June is typically a month of choppy and overlapping price action for gold.
-
The current correction in June is viewed as a buying opportunity for long-term investors.


Gold prices are consolidating on Wednesday and facing a lack of new fundamental or technical drivers for further upward movement. The Juneteenth holiday in the United States has likely contributed to thin liquidity around the US Dollar, keeping gold prices relatively stagnant. However, this thin trading environment also poses a risk of exaggerated price movements. On Tuesday, gold prices reversed an early decline, prompted by a modest decrease in US Treasury bond yields. This recovery was further supported by disappointing US Retail Sales data, which revived expectations of a US Federal Reserve (Fed) rate cut in September, weakening the US Dollar and boosting gold.
The data revealed that US Retail Sales rose by just 0.1% in May 2024, with the previous month's figures revised significantly lower to -0.2%. This adjustment indicates that economic activity remained subdued in the second quarter. Consequently, market expectations for a Fed rate cut in September increased to 67%, up from 61% the previous day, according to the CME FedWatch tool. Additionally, markets are pricing 48 basis points of rate cuts this year. Despite this, Fed policymakers have urged caution on inflation, suggesting a need for further signs of cooling before any policy easing. Chicago Fed President Austan Goolsbee noted the positive recent inflation figures. At the same time, St. Louis Fed President Alberto Musalem and Dallas Fed President Lorie Logan emphasized the importance of sustained progress towards the Fed's 2% inflation target.
Since the gold market lacks major macroeconomic events, it is likely driven by broader market sentiments and expectations of a Fed interest rate cut.
Gold long-term technical picture
June is historically known for choppy and overlapping price action in the gold market, based on the past 50 years of data, and 2024 is proving to be no different. As June began, gold prices started to consolidate within ranges. This choppy and overlapping pattern typically leads to price weakness and corrections.
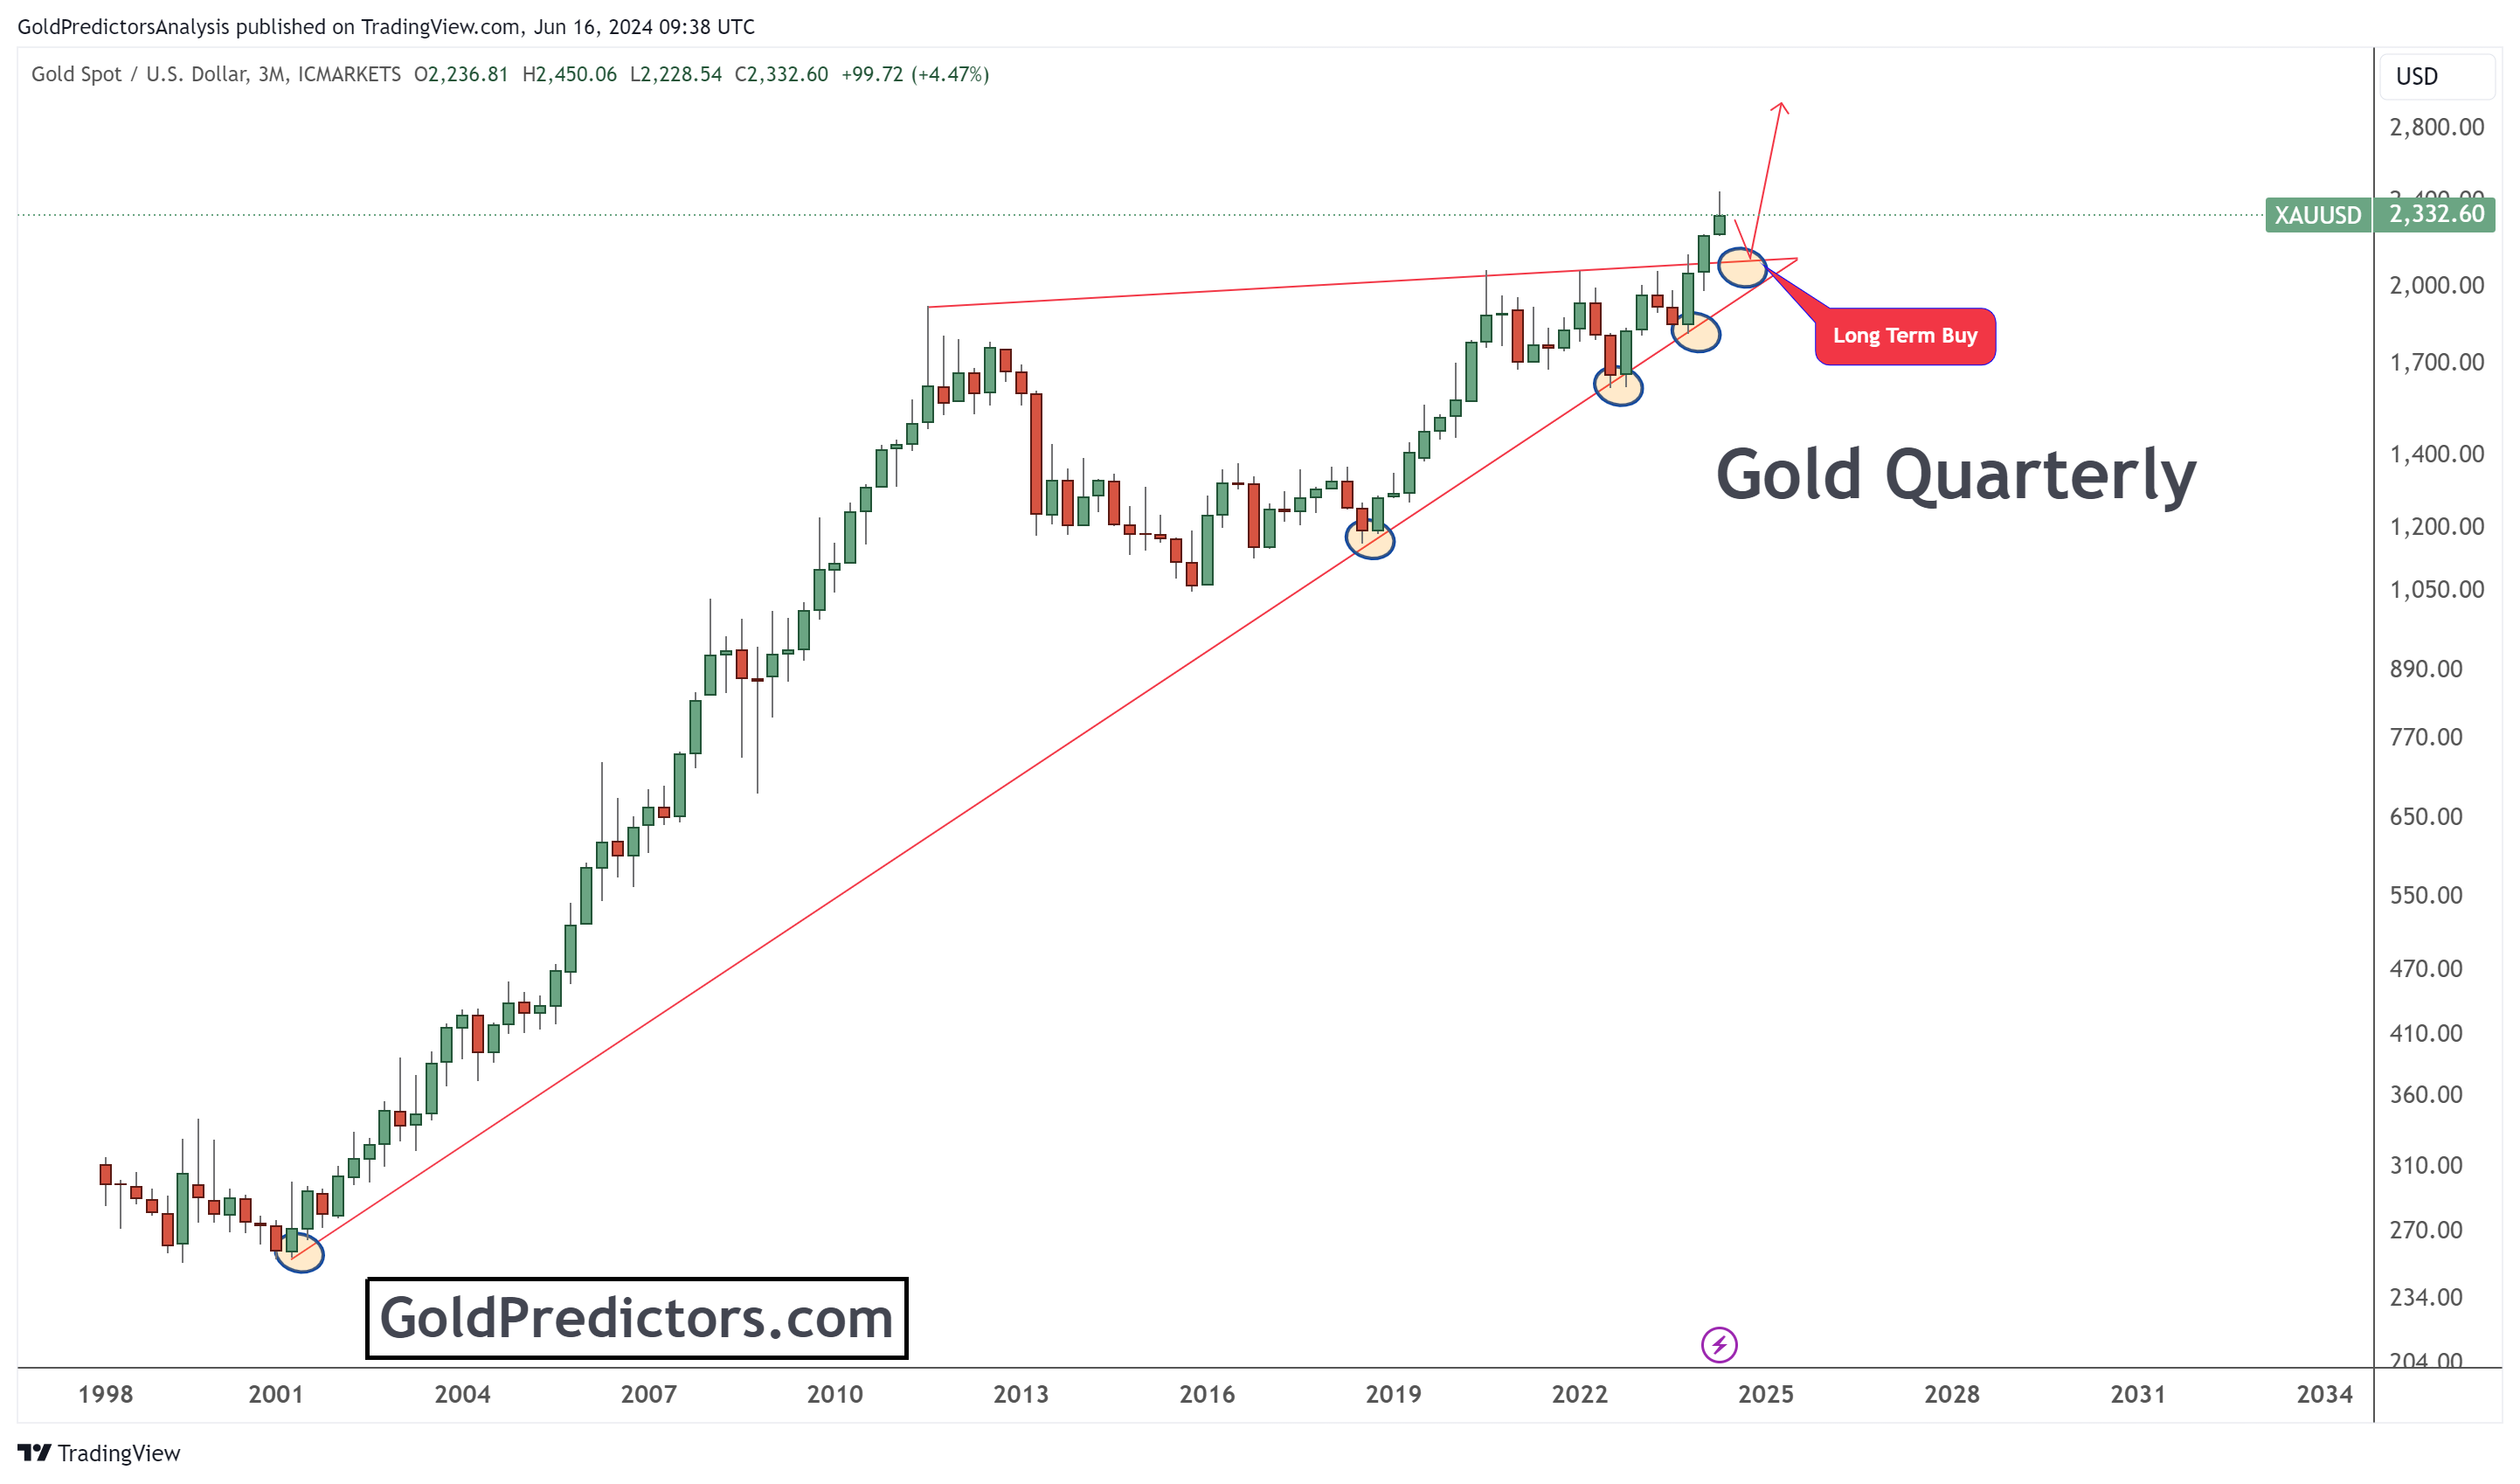
However, since the gold market has broken the long-term pivotal area of $2075, as previously discussed, it is likely to continue trading higher in 2024. Therefore, the current correction in June is seen as a buying opportunity for long-term investors. The quarterly chart further strengthens this outlook, showing that prices have now broken out of a triangle formation and are poised to trade higher. The quarterly candle for Q2 2024, which is due to be confirmed in 10 days, will solidify the direction of this move. Any price correction to the highlighted circle area on the chart is considered a buying opportunity for long-term investors targeting the $3000 region.
Bottom line
In conclusion, while gold prices are currently consolidating and facing a lack of new fundamental or technical drivers, the market remains sensitive to broader sentiments and expectations of a Federal Reserve rate cut. Due to the Juneteenth holiday in the United States, the thin trading environment has contributed to the current price stagnation and poses a risk of exaggerated movements. The recent disappointing US Retail Sales data has revived hopes for a Fed rate cut in September, which has weakened the US Dollar and supported gold prices. Historically, June is a month of choppy and overlapping price action for gold, and 2024 is consistent with this pattern. Despite short-term corrections, the long-term outlook for gold remains bullish, especially with the market breaking the long-term pivotal area of $2,075 and showing solid technical indicators. Therefore, the current price correction is a strategic buying opportunity for long-term investors, expecting gold to soon target the $3,000 region. The strong support lies around the $2272 region.
Unlock exclusive gold and silver trading signals and updates that most investors don’t see. Join our free newsletter now!
Unlock exclusive gold and silver trading signals and updates that most investors don’t see. Join our free newsletter now!
Author