Gold price analysis: XAU/USD short recovery and continue to bearish in the long-term
Yesterday, the DXY - US Dollar Index, increased sharply from 89.7 to 90.3. This is the strongest and fastest increase in February, while the numbers create a positive outlook for the US economy. On the other hand, in the last two speeches of the President of the US Federal Reserve - J. Powell, he always assured investors, that the US economy is in a recovery period. He will keep waiting for new growths. He also promised to stop monetary easing (through QE packages), stop buying monthly bonds, raise interbank interest rates and control the Yield Curve if the economy grow better in Q3/2021.
Gold dropped sharply from $1795/oz to $1765/oz in New York session, then recover to $1772/oz in Asian session. The dropping sharply yesterday is caused by the moving to keep interest rates unchanged of J. Powell (I mentioned above). Additionally, after the statement of controlling the Yield curve of government bonds, the US economy began to generate positive news. Theoretically, when the Yield curve of government bonds increases, it means that the safe-haven assets like Gold will be negatively affected.
Trend analysis
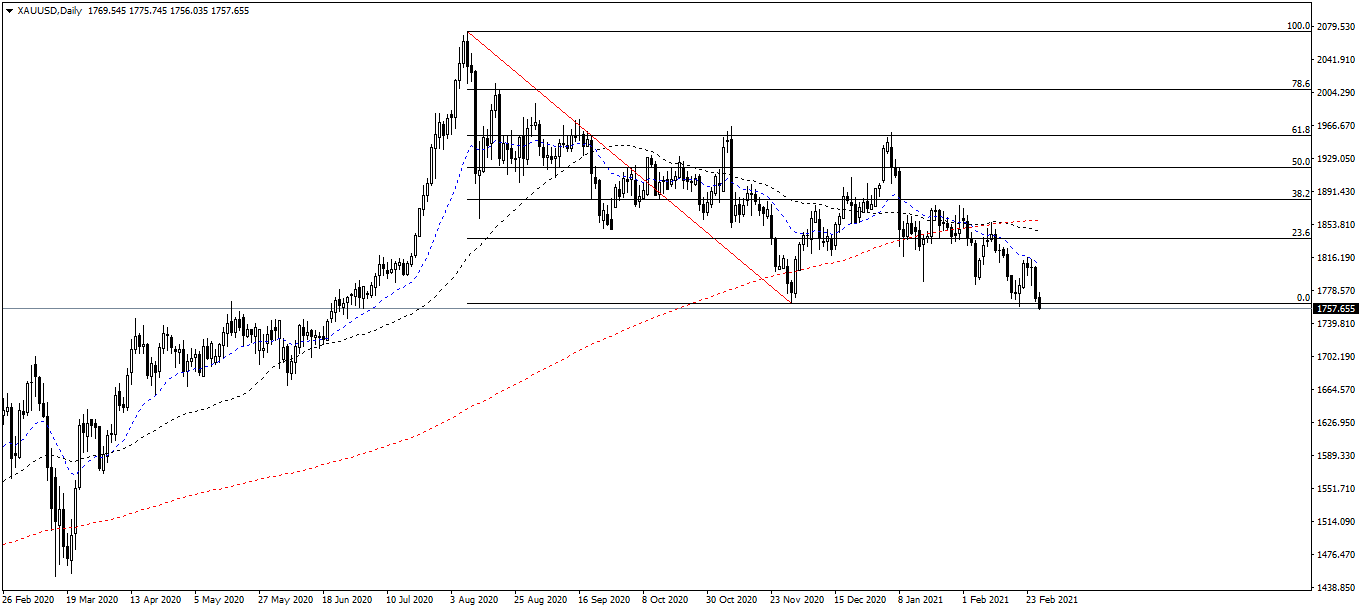
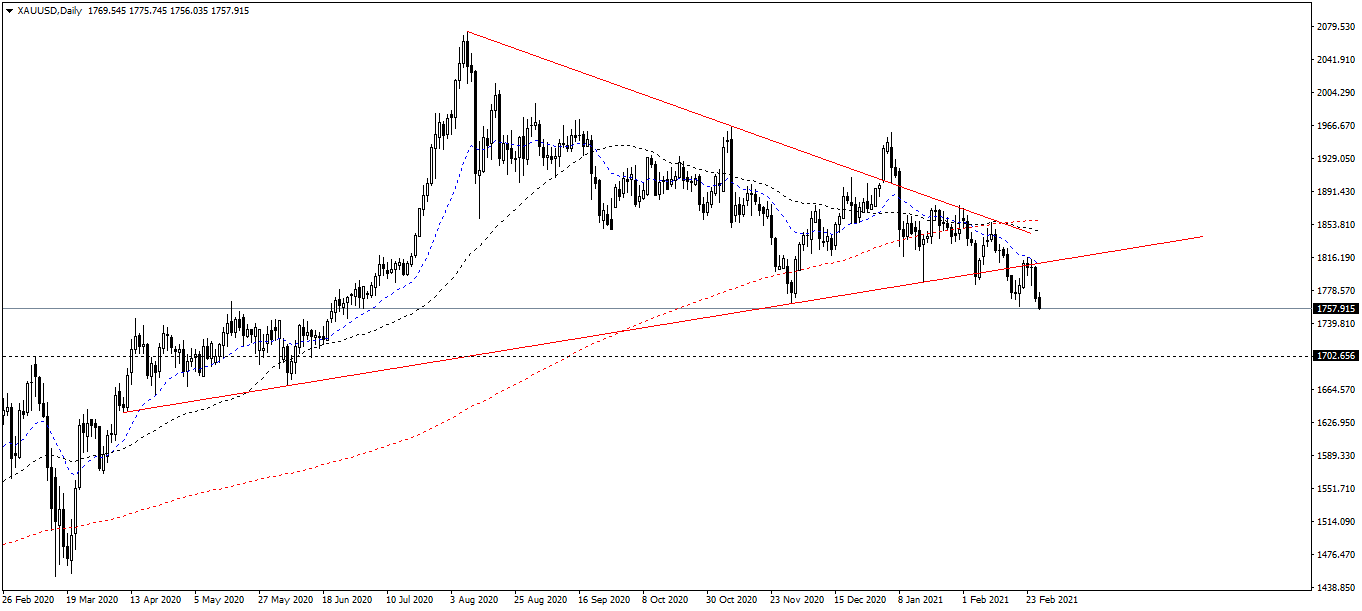
On the Daily chart, Gold entered a break-out pattern. This is the time to decide whether the Gold will break the Uptrend (formed from April 2020) and begin a new Downtrend. Investors should observe Gold moving in London session and New York session to have accurate trading decisions.
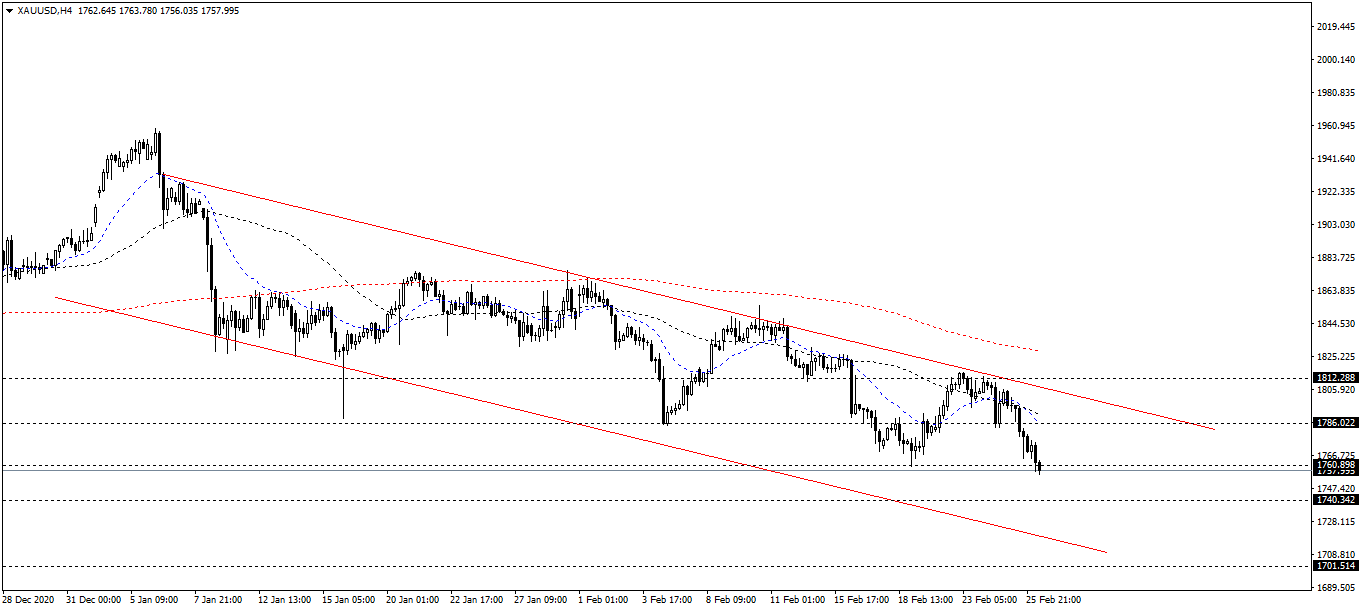
On the 4-hour chart, Gold continues its mid-term and long-term Downtrend. The maximum wavelength may decreases at $1708/oz - $1720/oz. (see chart below)
Resistance/support analysis
Gold is stopping at the support zone of $1765/oz and there is no new volume to move. Note, the $1765/oz is a strong support zone and the gold has dropped to this price twice in 2021. If Gold breaks $1765/oz, the next support $1745/oz will be considered. However, in the next London session and New York session, Gold may continues to increase and adjusts to the resistance of $1785/oz.
The resistance levels are $1785/oz, $1815/oz.
The support levels are $1765/oz, $1745/oz and $1710/oz.
Fibonacci analysis
The Fibonacci tool is measured on the daily chart at the 2070/1760. For the second time in February, Gold touched down to the Fibonacci level 0. This is the decisive Fibonacci level, a psychological resistance in the past 6 months.
Moving average MA
On the Daily chart, the EMA20 continues to decline clearly and goes away from the SMA200. In addition, the SMA50 crossed the SMA200 and went down, shows a positive signal for the Bear next week.
On the 4-Hour chart, the EMA20 cuts the SMA200 and falls down, shows a mid-term reversal. However, when analyzing above the EMA20/SMA50, a bullish reversal signal appears and the downtrend is not clear, a beartrap also.
On the 1-Hour chart, the EMA20 flats, shows indecision in the Asian session, which is expected to shape a side away in short-term. The SMA50 crossed the SMA200 and turned down, some extremely weak signals suggests that the trend reversal is still probable on this chart.
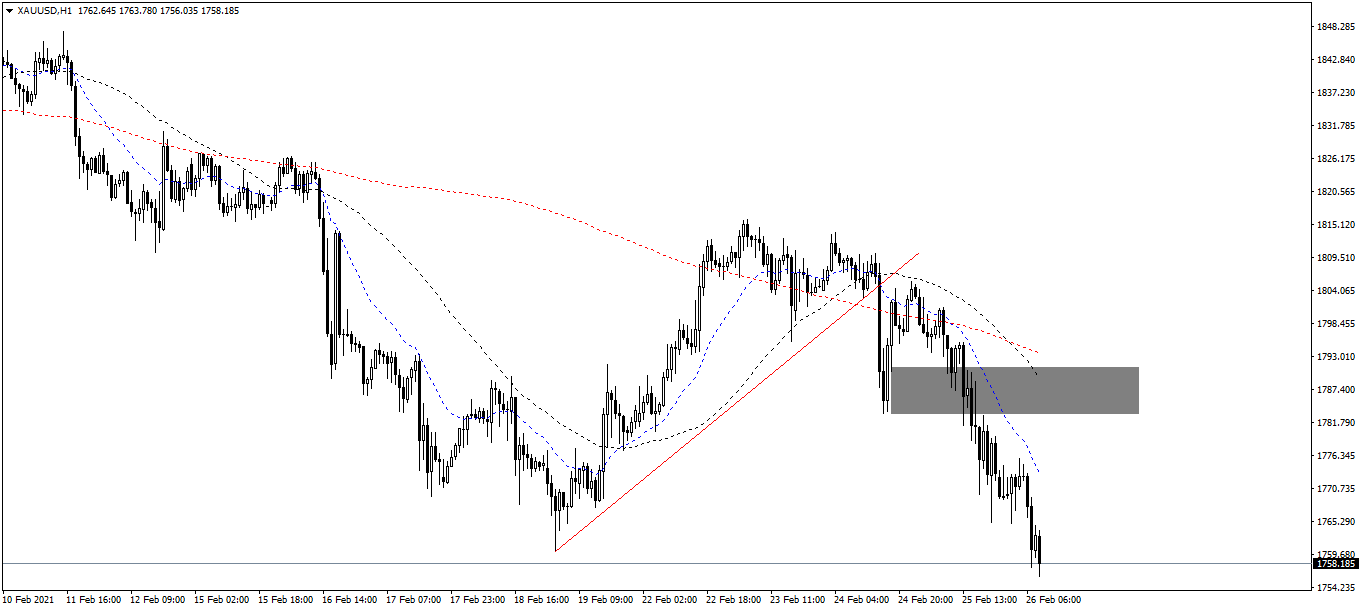
Note:
The 20 EMA is the blue line on the chart.
The 50 SMA is the black line on the chart.
The 200 SMA is the red line on the chart.
Author

Thang Le
Independent Analyst
Thang Le is founder and owner of PSK - a financial community in Vietnam which at: Advising on strategic investment for individuals; Supporting the development of the investment community. He is Financial Analyst at Lion Group Hol


