Gold price analysis: Will gold break resistance at $2,790?

Gold (XAU/USD) has maintained a strong tone heading into the European session on Monday and drops to $2750. The drop is fueled by a strengthening US Dollar, recovering from its recent lows. However, both fundamental and technical factors suggest caution before placing aggressive bearish bets, as geopolitical and macroeconomic dynamics influence the broader outlook for gold.
Fundamentals: Trade tensions and monetary policy
Gold's recent price action reflects a delicate balance between global risk sentiment and US monetary policy expectations. Renewed concerns about US trade policies, including President Donald Trump’s decision to impose emergency tariffs on Colombian imports, have reignited fears of a trade war. Investors' risk appetite has diminished, driving a flight to safety that traditionally supports gold prices. However, a simultaneous US dollar recovery has exerted downward pressure on gold.
Trump’s tariffs on Colombia, potentially escalating to 50%, highlight the uncertainty in global trade dynamics. Reports suggest similar measures may target Mexico and Canada soon, further straining international relations. These developments could support gold's appeal as a safe-haven asset in the near term.
Meanwhile, the Federal Reserve's potential rate cuts add another layer of complexity. Trump’s calls for immediate rate reductions have fueled expectations of two cuts in 2025, leading to a decline in US Treasury yields. This scenario could limit the US dollar’s upside potential and provide a floor for gold prices, even as they face short-term corrections.
Technical analysis: Key levels and patterns
The weekly gold chart illustrates a clear, bullish structure, with significant milestones marked by breakouts and consolidations. The base pattern formed in early 2023 served as a foundation for gold’s upward trajectory, confirmed by two notable breakouts highlighted in red. These movements reflect periods of strong bullish momentum.
Subsequent bullish consolidations further validated the trend, allowing gold to sustain higher levels and prepare for its next leg up. Gold trades near a key resistance zone around $2,750-$2,790, with price action suggesting a potential breakout or rejection at this level. A clear breakout above this resistance could pave the way for a strong surge toward new highs.
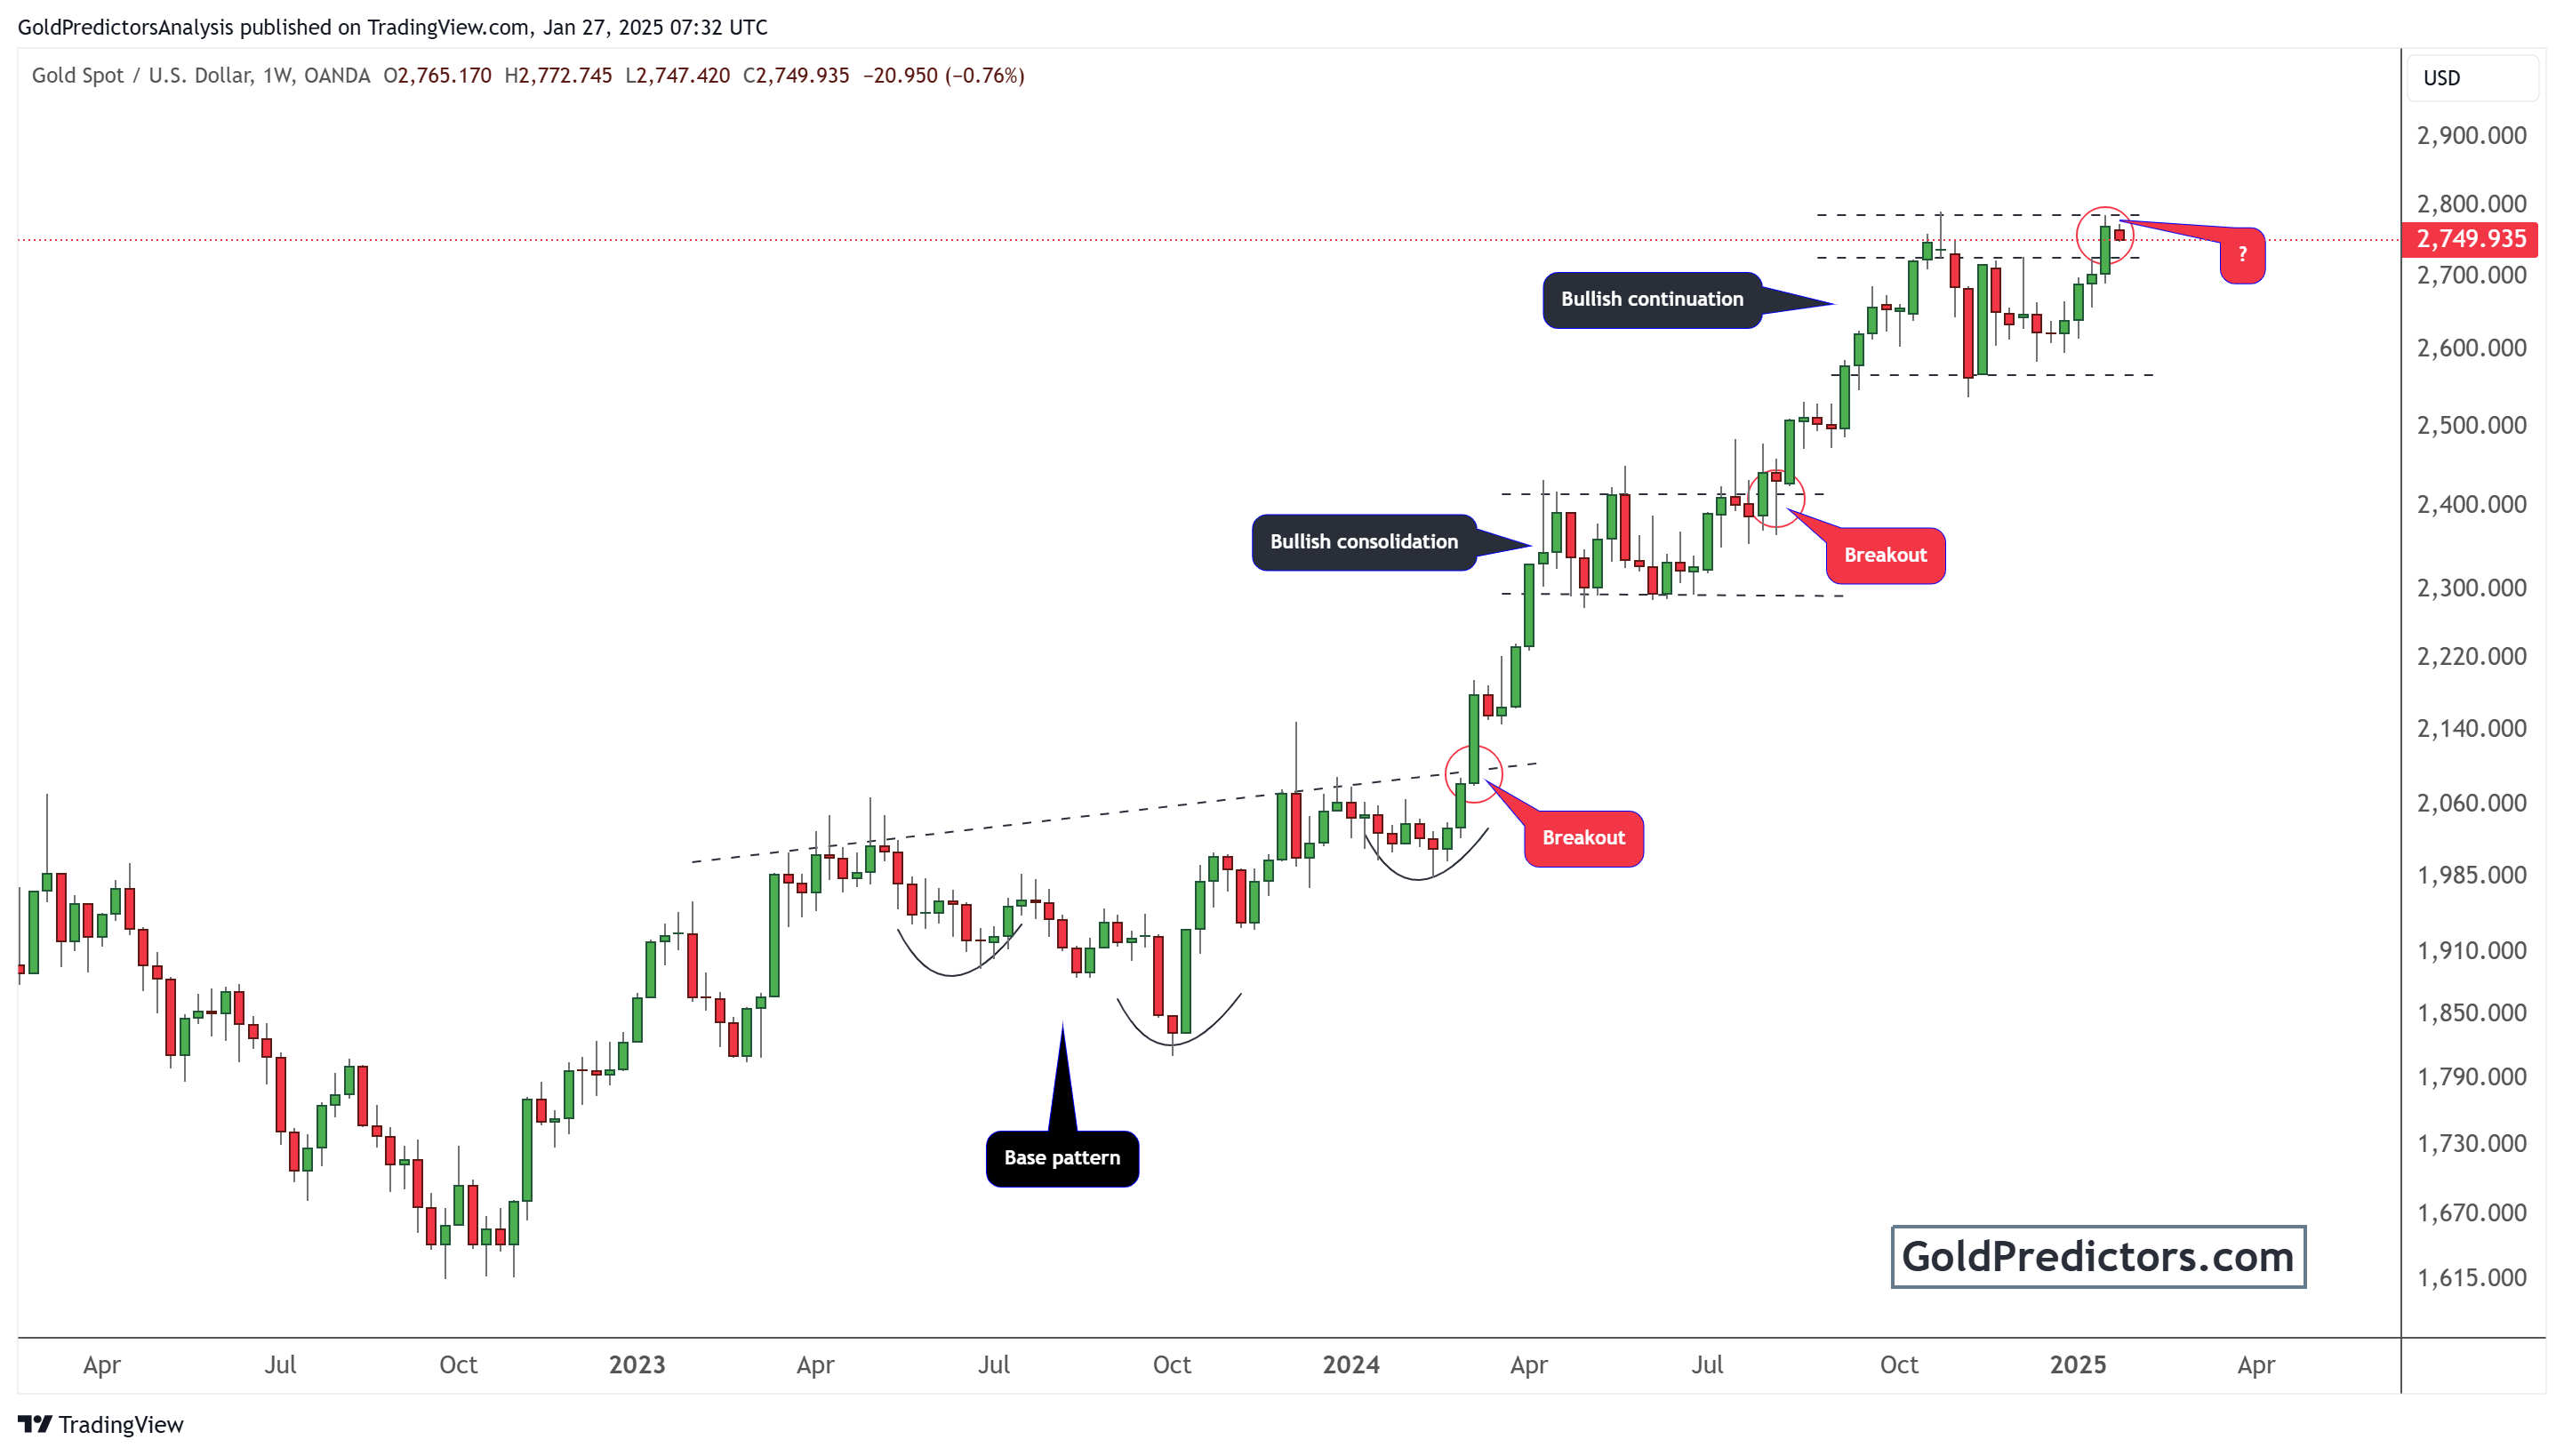
The ongoing retracement indicates a healthy correction within the broader uptrend. Technical indicators suggest that a bounce from support levels near $2,700 could act as a buying opportunity, aligning with the wider bullish sentiment. However, failure to hold these levels might signal deeper corrective moves.
Conclusion
Gold prices remain in a pivotal zone as fundamentals and technicals collide. On the one hand, geopolitical tensions and dovish Fed expectations support the metal’s safe-haven appeal. Conversely, the US dollar recovery and near-term resistance levels cap upside potential.
Traders should monitor key economic data, such as Durable Goods Orders and Consumer Confidence, for additional cues on gold's direction. A decisive breakout above $2,790 could reignite the bullish rally, while further corrections may provide strategic buying opportunities for long-term investors.
Gold’s resilience amid global uncertainty underscores its role as a hedge in volatile markets. The retracement should be viewed within a broader bullish trend, with caution warranted before adopting a bearish outlook.
Unlock exclusive gold and silver trading signals and updates that most investors don’t see. Join our free newsletter now!
Unlock exclusive gold and silver trading signals and updates that most investors don’t see. Join our free newsletter now!
Author

Muhammad Umair, PhD
Gold Predictors
Muhammad Umair is a financial markets analyst and investor who focuses on the forex and precious metals markets.


