Gold price analysis: Gold is sideways at $1790/oz - $1810/oz

Gold has been sideways at the zone $1790/oz - $1810/oz for 2 weeks. The US market is significantly divergent because the cash is withdrawn from the ETF fund and the stock market. Moreover, the US 10Y bond yield fell from 1.61 to 1.23 which shows the "cash is king" trend this month.
The DXY - US Dollar Index climbed up to the highest level in 2021. There is a chance for USD to come back as a reserve currency this year. Moreover, the FED announced some news in the beginning of July that they might put the rate up at the end of this year if the economic recovery comes closer.
Trendline analysis
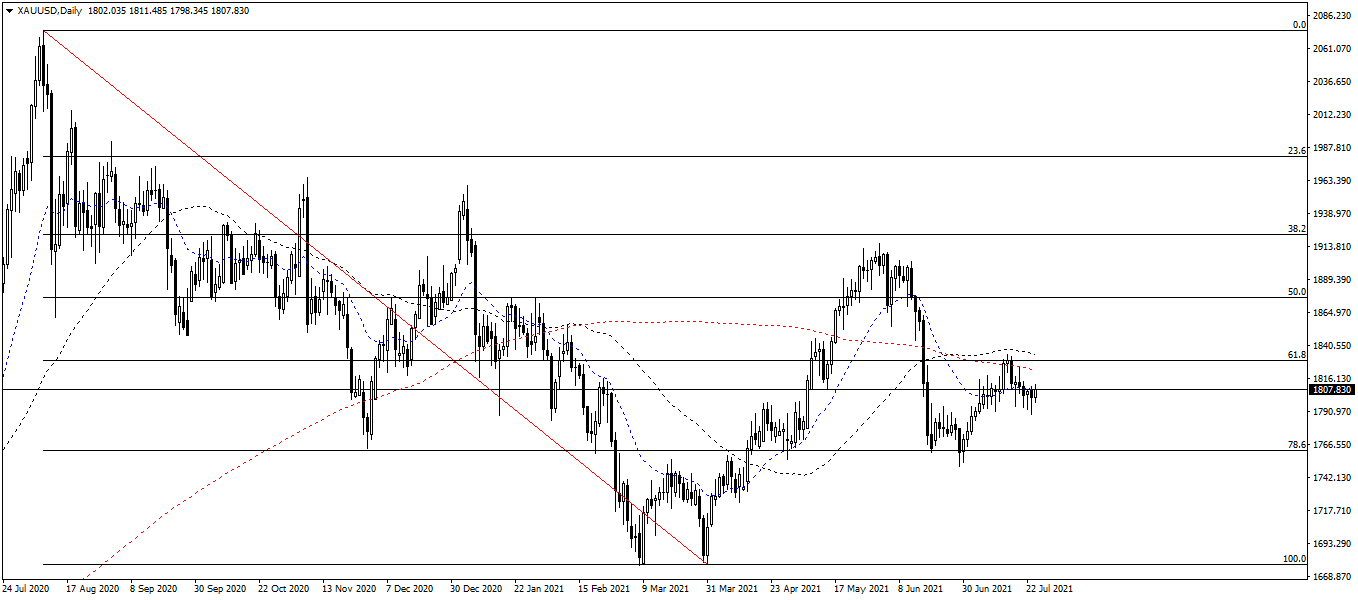
On the daily chart, the uptrend is broken by the bears at $1910/oz which made a significant negative to the bulls. Gold climbed up to $1818/oz and then fell back to the sideways zone $1790/oz - $1810/oz. However, there is not any significant trendline on this chart, at least this week. (see chart below).
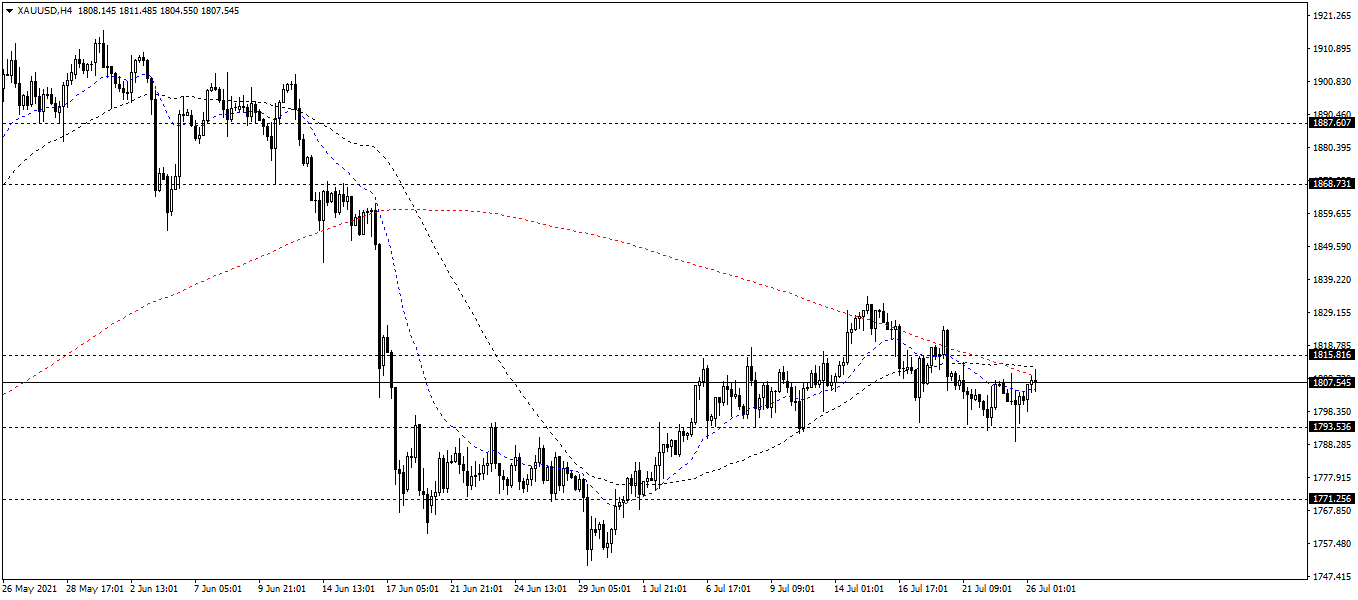
On the 4-hour chart, gold makes an accumulation. Same as the daily chart, there is no trendline. (see chart below).
Resistance/support analysis
The resistances are $1854/oz and $1887/oz.
The supports are $1770/oz and $1790/oz.
Fibonacci analysis
The Fibonacci has been measured on the daily chart at:
The $2080/oz: this is the highest price of gold over the time.
The $1760/oz: this is the oldest support on the bearish trend. (formed from August 2020).
Last week, gold reached the Fibonacci 61.8 ($1818/oz) but could not come over. This sign shows that the bulls is not ready for an uptrend. The Fibonacci is a dynamic resistance for the bulls this time.
Moving average analysis
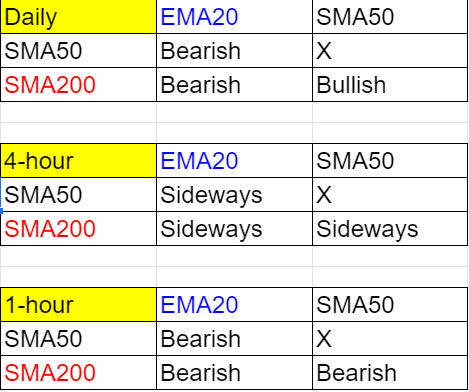
On the daily chart, there is a significant divergency. The SMA50 crossed the SMA200 and climbed up. The EMA20 is below the SMA200/SMA50, but draws a reversal sign.

On the 4-hour chart, the MA indicator shows a sideways sign. There is no significant movement in this chart.
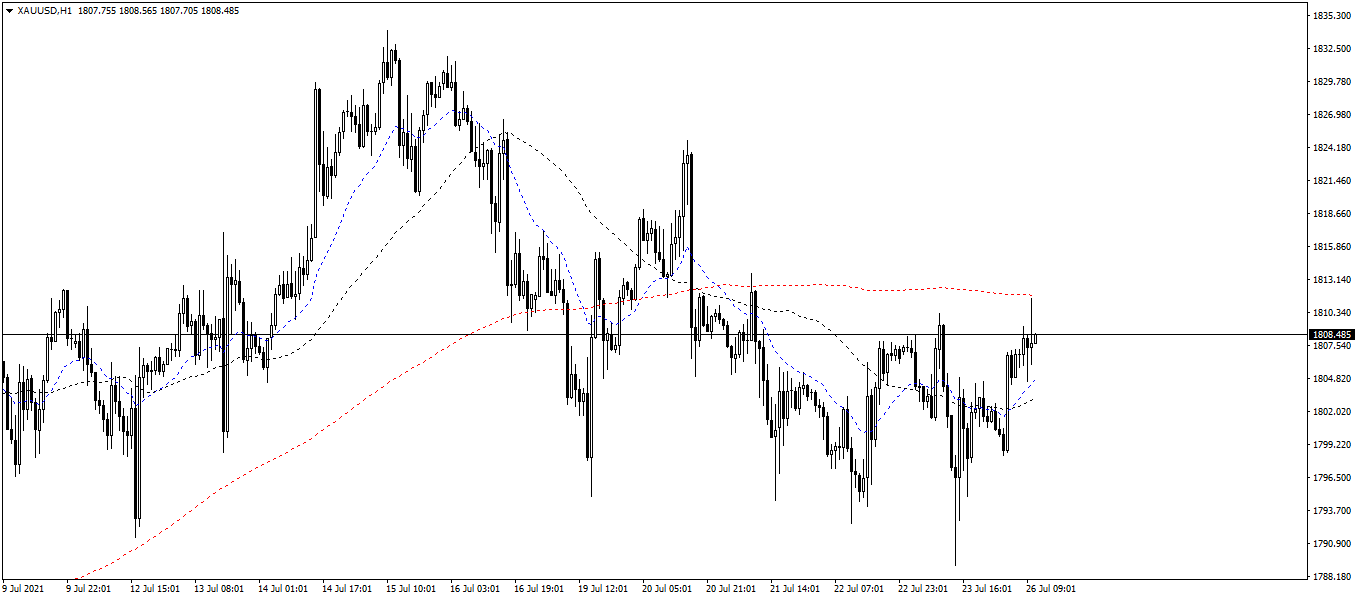
On the 1-hour chart, both the EMA20/SMA50 stroke over the SMA200 which means the bears is dominating this time. However, both the EMA20/SMA50 drew a reversal sign.
In conclusion, technically, there is no significant change. Gold is sideways and investors should keep an eye to the GDP news this Thursday.
Author

Thang Le
Independent Analyst
Thang Le is founder and owner of PSK - a financial community in Vietnam which at: Advising on strategic investment for individuals; Supporting the development of the investment community. He is Financial Analyst at Lion Group Hol


