Gold price analysis: Gold is sideways at $1770/oz – $1790/oz

Gold has created an accumulation zone at $1170/oz - $1795/oz for a week. The DXY - US Dollar Index is moving around 91.8, the highest level in the past 3 months.
A few days ago, Janet Yellen - Minister of Finance (well known as Secretary of the Treasury) had a speech about the risk management of the "No. 1st economy world" in the next 3 months. In this speech, Yellen said that the US Congress should focus on national debt instead of doing too much on QE creating. Moreover, "to avoid uncertainty for financial markets, Congress should pass new debt limit legislation - allowing the Treasury to continue borrowing - before the latest suspension expires on July 31", said by Yellen.
This week, The Bureau of Labor Statistics will release the unemployment rate and non-farm employment change. This will make a significant impact on the USD and gold these days.
Trendline Analysis
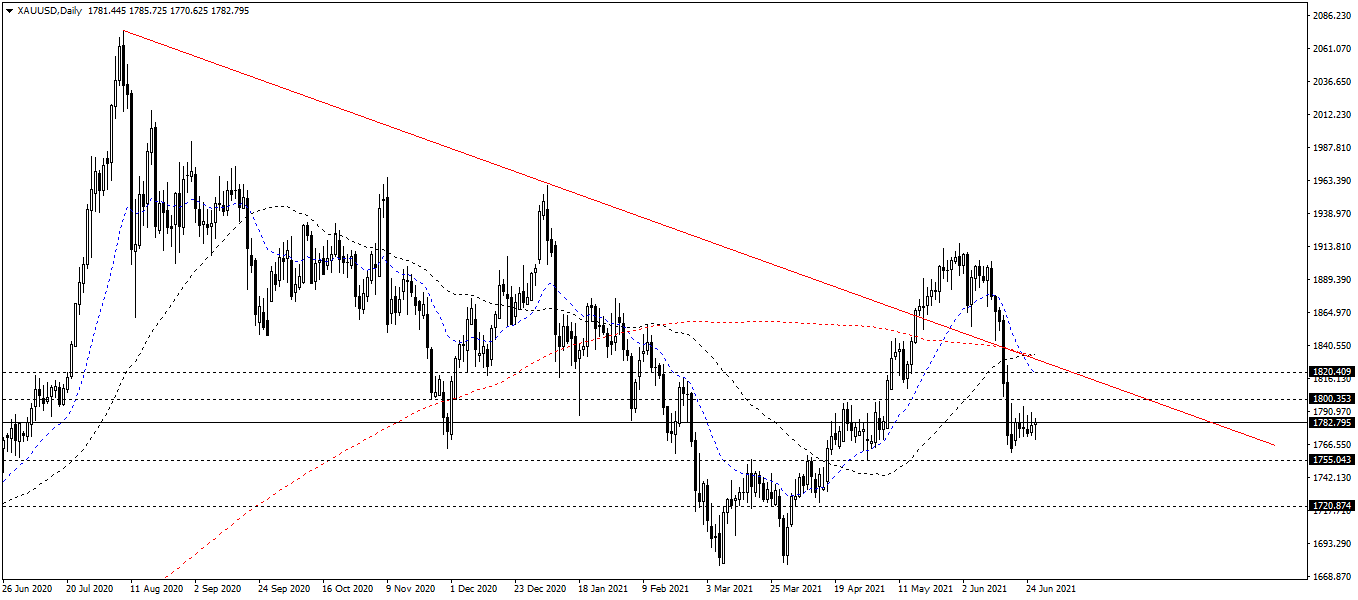
On the daily chart, gold is on the phase 2 (accumulating/retest phase) of the break-out pattern. You can see this sideway trend by: low volume, fixed zone $1770/oz - $1790/oz, low ATR indicator, low volatility,... These supports $1755/oz and $1720/oz affect significantly on the bears. In contrast, these resistances $1800/oz and $1820/oz is the punchline for the bulls to push gold to higher level. (see chart below)
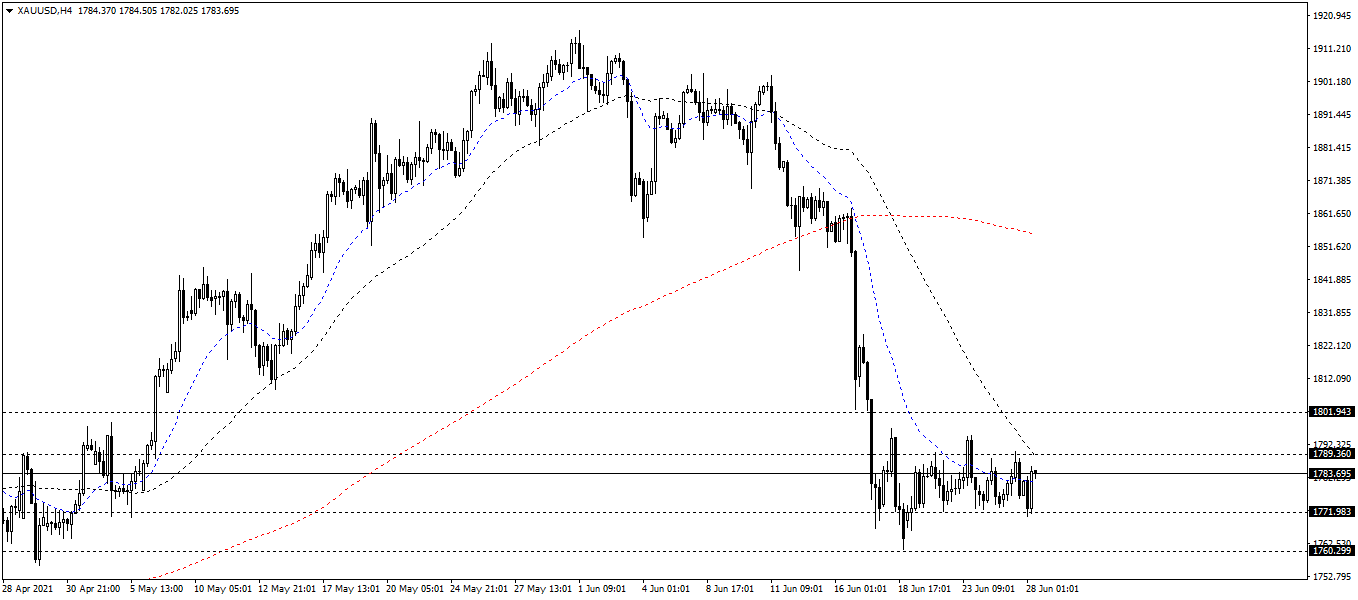
On the 4-hour chart, gold is sideways around the narrow zone $1772/oz - $1992/oz. (see chart below)
Resistance/Support Analysis
-
The resistances are $1820/oz and $1800/oz.
-
The supports are $1775/oz and $1720/oz.
Fibonacci Analysis
The Fibonacci has been measured on the daily chart at:
-
The $2080/oz: this is the highest price of gold over the time.
-
The $1760/oz: this is the oldest support on the bearish trend. (formed from August 2020).
Gold is still above Fibonacci 61.8. If this week's candle collapses and below the Fibonacci 61.8, the bears will control. In contrast, the bulls will dominate if the weekly candle closes above Fibonacci 61.8 this week.
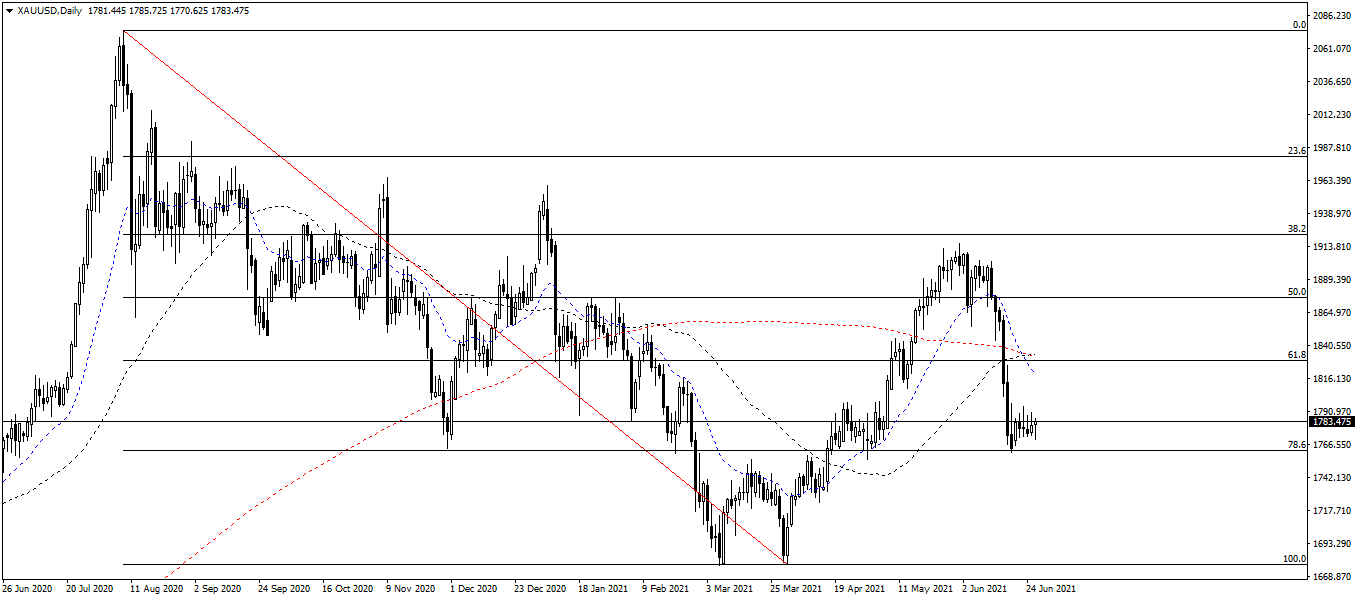
Moving Average MA Analysis
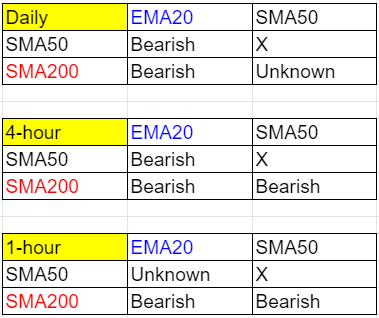
On the daily chart, the EMA20 crossed both the SMA50/SMA200 and went down. The SMA50 reached the SMA200 for the first time in the last 4 months which means that gold is slowly creating a new trend almost next week.
On the 4-hour chart, both the EMA20/SMA50 are below the SMA200, showing a strong bearish trend.
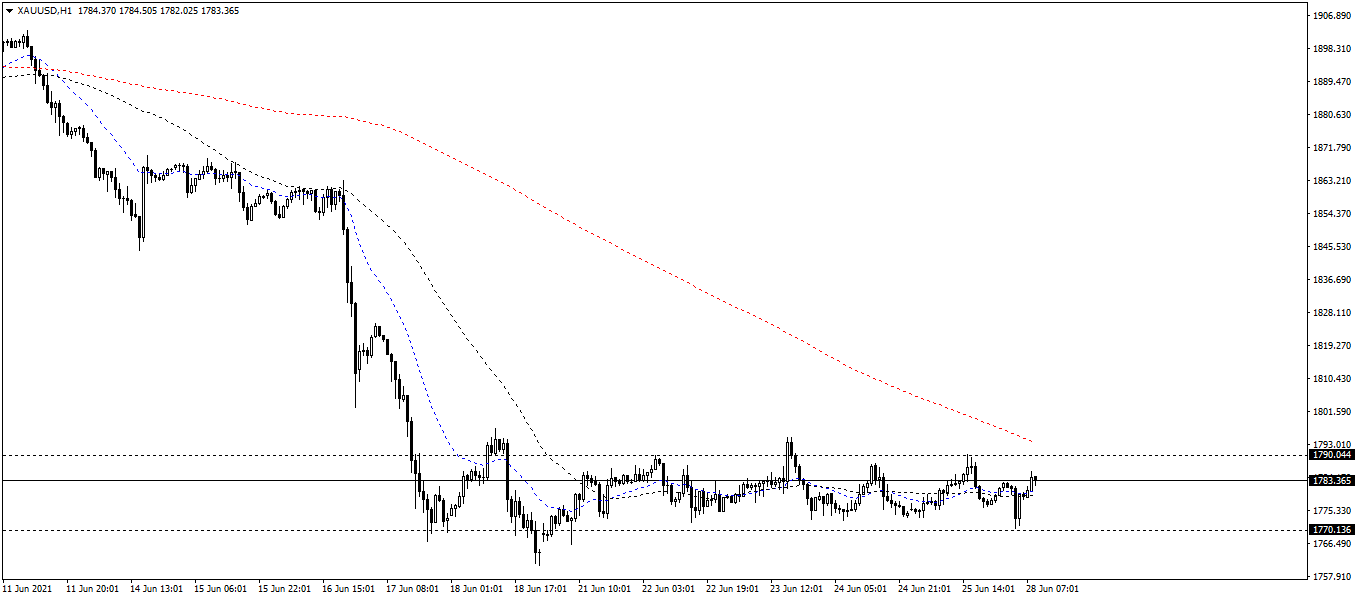
On the 1-hour chart, both the EMA20/SMA50 are below the SMA200, showing that the bears is dominating this chart these days.
Author

Thang Le
Independent Analyst
Thang Le is founder and owner of PSK - a financial community in Vietnam which at: Advising on strategic investment for individuals; Supporting the development of the investment community. He is Financial Analyst at Lion Group Hol


