Gold plunges 3.40% as Dollar surge, rising rate bets crush safe-haven appeal
- Gold price tumbles as surging U.S. dollar demand turns short-term market sentiment bearish.
- Rising crude oil prices stoke inflation fears, altering Fed rate expectations and affecting gold’s outlook.
- CME FedWatch shows rate cuts repriced, lowering support for further gold rally momentum.
- Iran threatens to fire on ships crossing the Strait of Hormuz.
- Market attention shifts to inflationary risks, analysts say.
- Silver, platinum, and palladium plunge sharply.
Spot gold slid over 4% on Tuesday as some investors chose the dollar over gold amid the US-Israeli air war with Iran, and traders pared back rate-cut expectations amid inflation worries.
Spot gold fell 3.3% to $5,150.89 an ounce by 13:50 GMT, after earlier dipping to its weakest level since Feb. 20.
The U.S. dollar climbed 0.9% to a one-month high and Treasury yields surged, making dollar-priced gold costlier for foreign buyers and increasing the opportunity cost of holding the non-yielding metal, while the Nasdaq led U.S. futures lower with a 2.3% drop on Tuesday.
Global oil and gas shipping rates surged after an IRGC official declared the Strait of Hormuz closed and warned ships would be fired upon, stoking inflation fears.
Although gold is a long-term inflation hedge, higher inflation can lift real yields and strengthen the dollar, keeping borrowing costs high and curbing demand for the non‑yielding metal.
Current target rate – 3.50 - 3.75
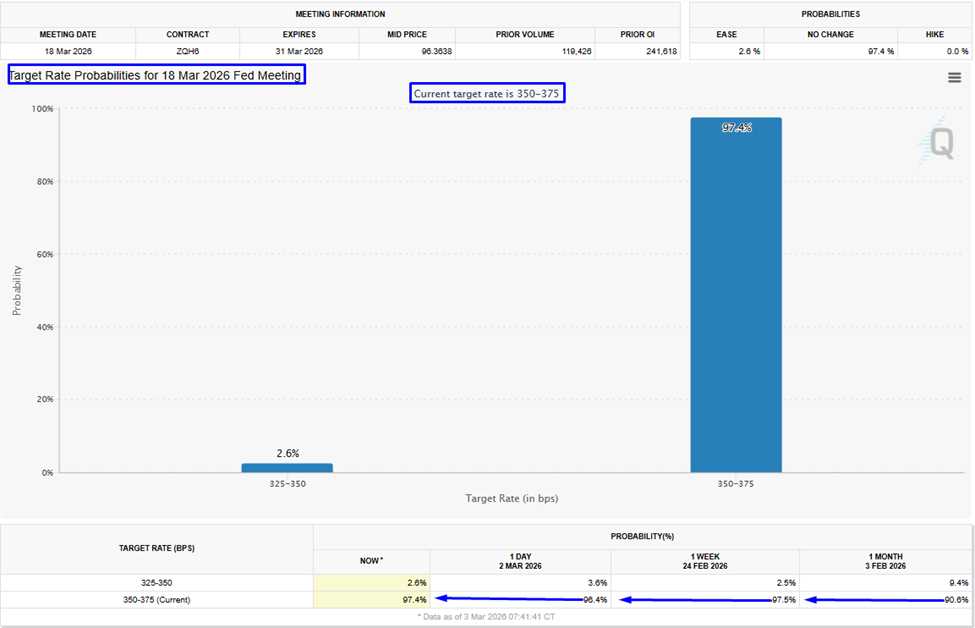
- CME FedWatch March no rate change probabilities have moved higher to 97.4% today from 90.6% on February 02, 2026.
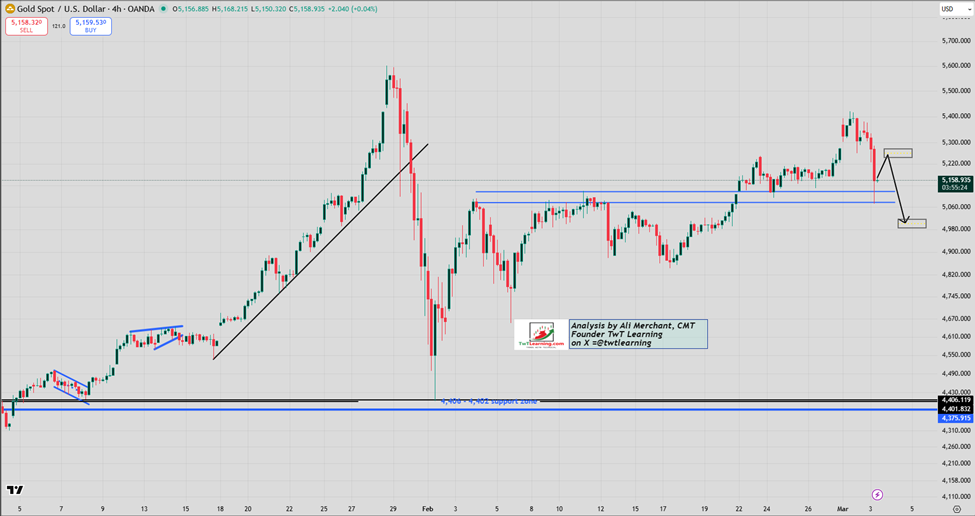
Gold/US Dollar
- Gold rallied as mentioned in our last report.
- Prices are holding $5,118 to $5,075 base, which was the point of acceleration in the recent rally.
- XAU may roll higher to $5,205 -$5,240 in a corrective fashion.
- Gold will role lower once the upside correction is over.
- Downside target is around $5,000.
Gold four-hourly chart
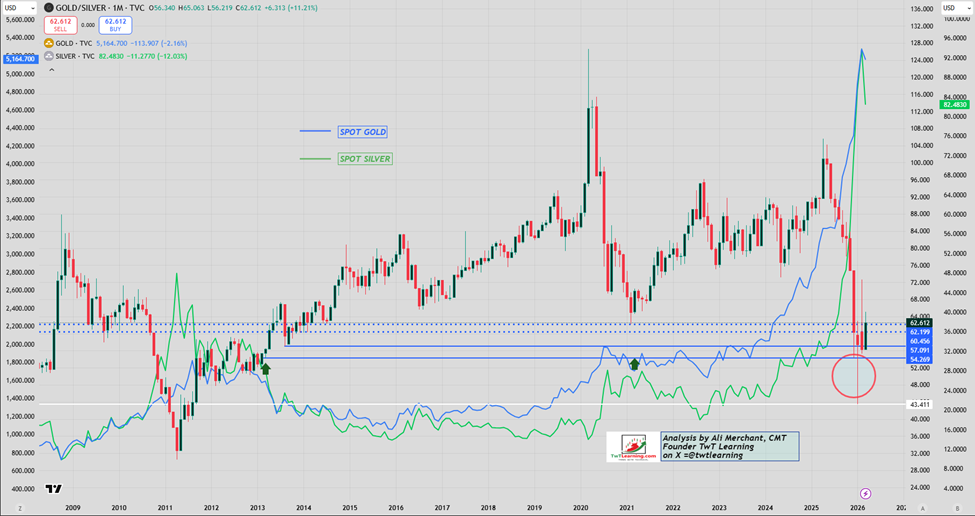
Gold/Silver ratio
- The gold–silver ratio measures how many ounces of silver are needed to buy one ounce of gold (gold price ÷ silver price), a key gauge of relative value and potential moves.
- Ratio is hovering between 65 to 56 range meaning within February range.
- This ratio moving higher means both Gold and Silver would decline in the coming weeks.
Gold/Silver ratio monthly chart
Author

Ali Merchant, CMT
TwT Learning
Ali Merchant is a seasoned financial market professional with expertise in Technical Analysis, Treasury & Capital Markets, Trading, Sales, Research, Training, & Fund Management, He has been trading FX, FX options, US stocks & opti


