EUR/USD Elliott Wave: Incomplete bearish pattern

Executive summary
- Price appears trapped within a bearish pattern.
- The current decline model appears incomplete.
- Price is bearish while below 1.1685.
Current Elliott Wave analysis
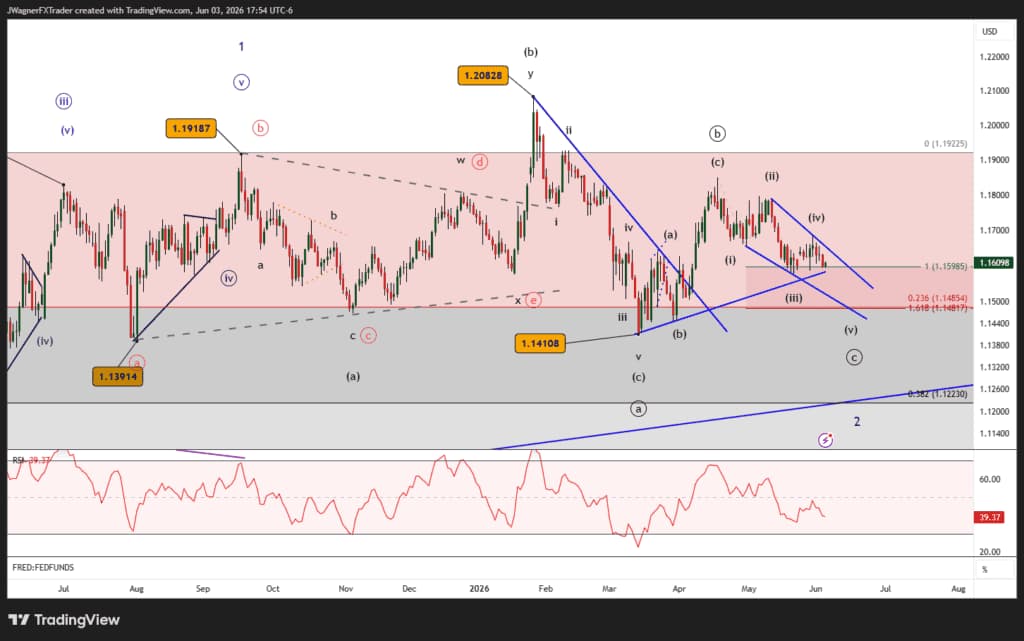
Reviewing the daily price chart on EURUSD, when I stand back and look at the screen, I see bearish patterns.
Prices are currently challenging the support trend line dating back to March 2026. Eventually, this probably will break down and we’ll see a retest of 1.1410.
The key Elliott wave pattern to this picture is the rally from March 13 to April 17.
That pattern is clearly a 3-wave zigzag rally. This means the rally is corrective and likely to be fully retraced. This implies a decline back to 1.1410 and possibly lower levels.
The only way to make that rally a more bullish pattern would require starting the rally later, on March 30. However, that requires the previous down wave to be a truncated pattern which is rare.
Therefore, sticking with the probabilities, EURUSD appears to need a handshake with 1.1410 and possibly lower levels down into the 1.12 region. If that low takes place on divergence with DXY, then we’ll know it’ll become an important turning point.
Bottom line
The Elliott wave count we are tracing is that a renewed decline may carry EURUSD below 1.1410 and possibly down to 1.12. If EURUSD is successful in reaching those lower price levels, then we’ll consider looking for bullish reversals.
Author

Zorrays Junaid
Alchemy Markets
Zorrays Junaid has extensive combined experience in the financial markets as a portfolio manager and trading coach. More recently, he is an Analyst with Alchemy Markets, and has contributed to DailyFX and Elliott Wave Forecast in the past.


