Gold outlook: Tensions in the Mid-East

Gold’s price moved higher over the past week, reaching a new record-high level once again. In today’s report, we intend to lay out the main fundamental challenges for the precious metal, including the recent tensions in the Middle East between Israel and Hezbollah, as well as the release of the Fed’s interest rate decision last week. We will be concluding this report with a technical analysis of gold’s daily chart.
Israel strikes Hezbollah targets in Lebanon
On Monday morning, Israel’s military announced that it had launched strikes against Hezbollah sites within Lebanon. The tensions, arose when Israel started exploding pagers belonging to Hezbollah fighters last Tuesday and Wednesday, which resulted in thirty-seven deaths with nearly three thousand being injured, in addition to striking Beirut on Friday which resulted in the death of the Commander of Hezbollah’s elite Radwan Force. Moreover, Israel’s military conducted strikes against Hezbollah sites within Lebanon on Monday, resulting in at least 492 deaths according to a recent report by Reuters. Yet, despite tensions between Israel and Hezbollah escalating, Iran’s President Masoud stated on Monday that “we’re willing to put all our weapons aside so long as Israel is willing to do the same”, which may imply that the door for a diplomatic solution is open. In our opinion, we would not be surprised to see the situation escalate even further this week and potentially continue for some period of time, up until Israel has concluded that it has achieved its objectives. Thus the recent escalation of tensions in the region may amplify market concerns about a regional war, which in turn may aid gold’s price giving its status as a safe haven asset during times of geopolitical uncertainty. Therefore, should the matter escalate further this week with more strikes from both sides, it could aid the precious metal’s price. On the flip side, should a solution appear on the horizon, it may ease market worries of a further destabilization of the region and in turn could weigh on gold’s price.
The Fed cuts by 50bp
The Fed last Wednesday cut interest rates by 50bp, as was widely expected by market participants. The initial announcement of a 50bp rate cut was well received by market participants as it implies that the Fed’s rate-cutting cycle has now officially begun. In turn, the implications that the Fed has now begun to ease the tight financial conditions surrounding the US economy could weigh on the dollar and thus aid gold’s price given their inverse relationship. In particular, the precious metal appears to have formed a new all-time high near the $2600 per troy ounce figure, following the release of the Fed’s interest rate decision. Hence, given the inverse relationship between the precious metal’s price and the greenback, should Fed policymakers adopt a more dovish tone in the coming week, such as that of Chicago Fed President Goolsbee who stated earlier today that there are “many more” rate cuts ahead, it could aid gold’s price. On the flip side, should Fed policymakers imply that the Fed may need to remain on hold for a prolonged period on time, it could have the opposite effect and thus potentially weigh on the precious metal’s price.
Upcoming financial releases
The next big test for gold traders may be the release of the US Core PCE rates on Friday, which are the Fed’s favourite tool for measuring inflationary pressures in the US economy. Economists are currently anticipating the Core PCE rate for August on a month-on-month basis to remain steady at 0.2%, yet we view the year-on-year rate to be more significant. As such should the Core PCE rate for August on a year-on-year basis come in lower than the prior rate of 2.6%, it may imply easing inflationary pressures in the US economy which may in turn increase pressure on the Fed to continue on their rate-cutting cycle. Such a scenario could potentially weigh on the greenback whilst potentially providing support for gold’s price given their inverse relationship with one another. On the flip side, should the Core PCE rates showcase an acceleration or stubborn inflationary pressures within the US economy, it could have the opposite effect on gold’s price.
Technical analysis
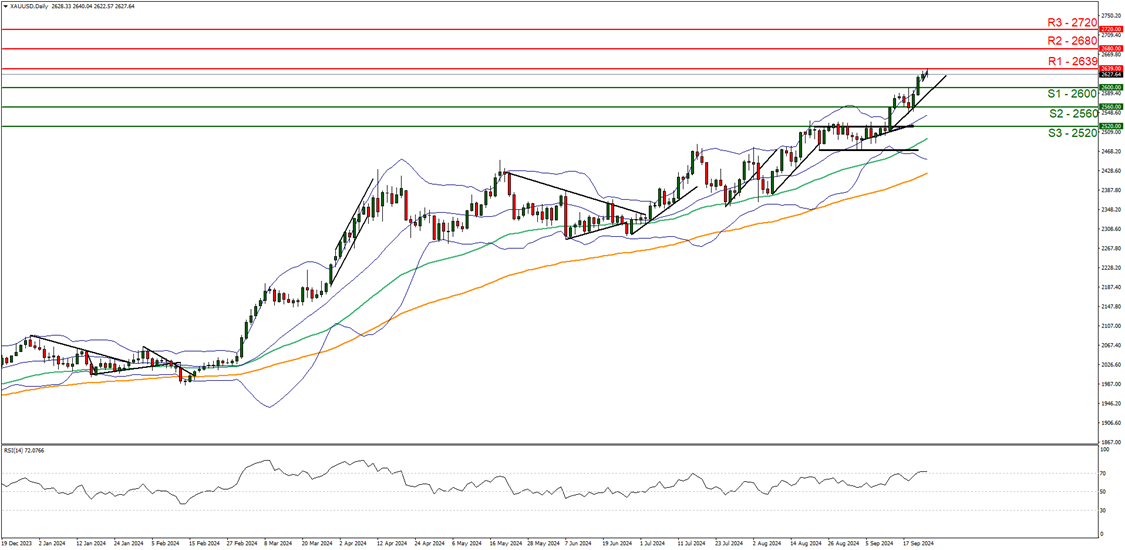
XAU/USD daily chart
-
Support: 2600 (S1), 2560 (S2), 2520 (S3).
-
Resistance: 2639 (R1), 2680 (R2), 2720 (R3).
Gold’s price seems to have hit a ceiling near the 2639 (R1) resistance line, which is a new record-high for the precious metal’s price. We tend to maintain our bullish outlook given that the upward trendline guiding gold’s price since the 12th of September, remains intact. Further supporting our case is the RSI indicator which currently registers a figure above of 70, implying a strong bullish market sentiment for gold. Yet the reading above 70, may also imply that the asset is overbought and may be due a market correction to lower ground. Nonetheless, for our bullish outlook to continue, we would require a clear break above the 2639 (R1) resistance level, with the next possible target for the bulls being the 2680 (R2) resistance level. On the flip side for a bearish outlook, we would require a clear break below the 2600 (S1) support level, with the next possible target for the bears being the 2560 (S2) support line. Lastly, for a sideways bias we would require the precious metal’s price to remain confined between the 2600 (S1) support level and the 2639 (R1) resistance line.
Author

Phaedros Pantelides
IronFX
Mr Pantelides has graduated from the University of Reading with a degree in BSc Business Economics, where he discovered his passion for trading and analyzing global geopolitics.


