Gold, miners, USD: What’s normal and what isn’t

You know what’s normal? When a market takes a breather after a volatile move - like the USD Index right now.
Miners shrug off Gold’s rally
And do you know what isn’t normal? When a market that is driven by some other market pretty much ignores its strong indications.
Just like what mining stocks did relative to gold.
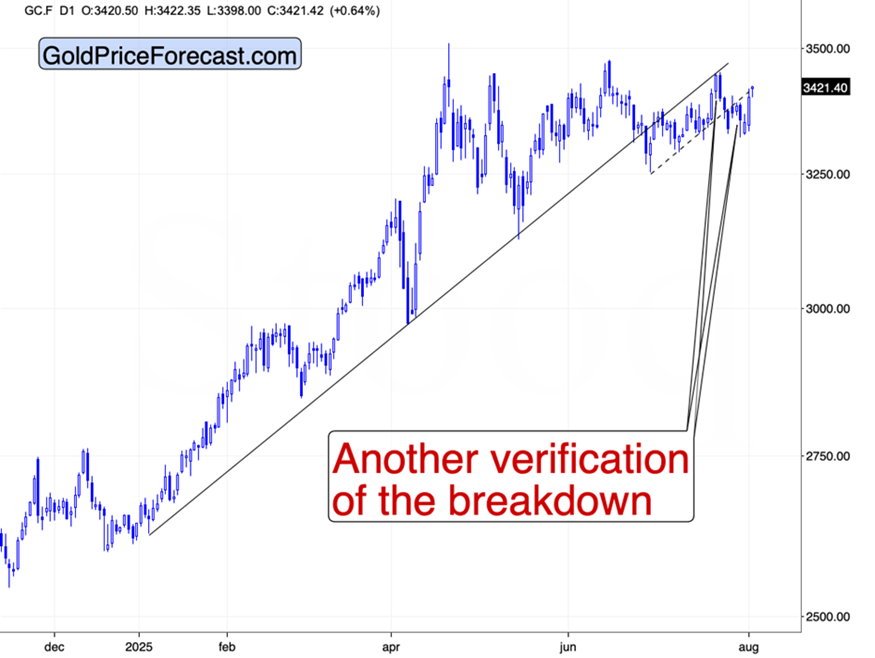
Gold rallied strongly on Friday, just like the USD Index declined strongly on that day. Technically, it didn’t change much for gold – it remains below the rising resistance line, and it also remains in perfect tune with its price pattern from 2011-2013.
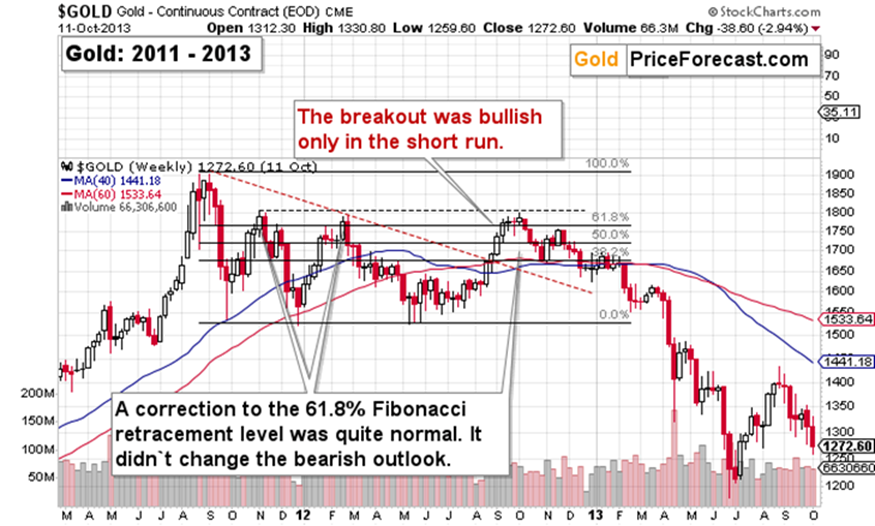
That November 2012 rally seems similar to the most recent quick upswing in gold.
But the action in gold is not as important as neither silver nor mining stocks (not even platinum) moved visibly higher on Friday. Yes, they took their own breathers, but nothing worth writing home about.
Now, the way miners ignored gold’s rally and failed to capitalize on it is something truly remarkable.
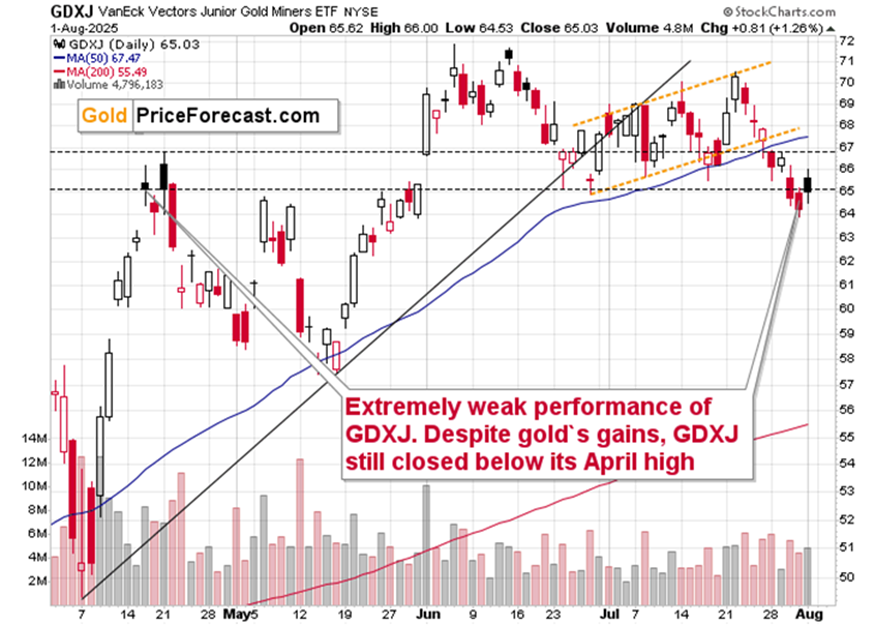
Not only did the GDXJ fail to rally in a meaningful way on Friday, but it actually closed the day below the April high (in terms of closing prices) for the third consecutive trading day – thus fully confirming this move.
In today’s pre-market trading, the GDXJ is at $66 at the moment of writing these words, which is still a negligible rally given the size of the late-July decline. This is a regular breather, whose size fully confirms the bearish implications of the whole setup.
Gold stocks tend to outperform gold in the first parts of rallies in the precious metals sector. We have exactly the opposite right now. The implication is that this is the very early part of a bigger decline.
Meanwhile, the USD Index is getting ready to rally much more.
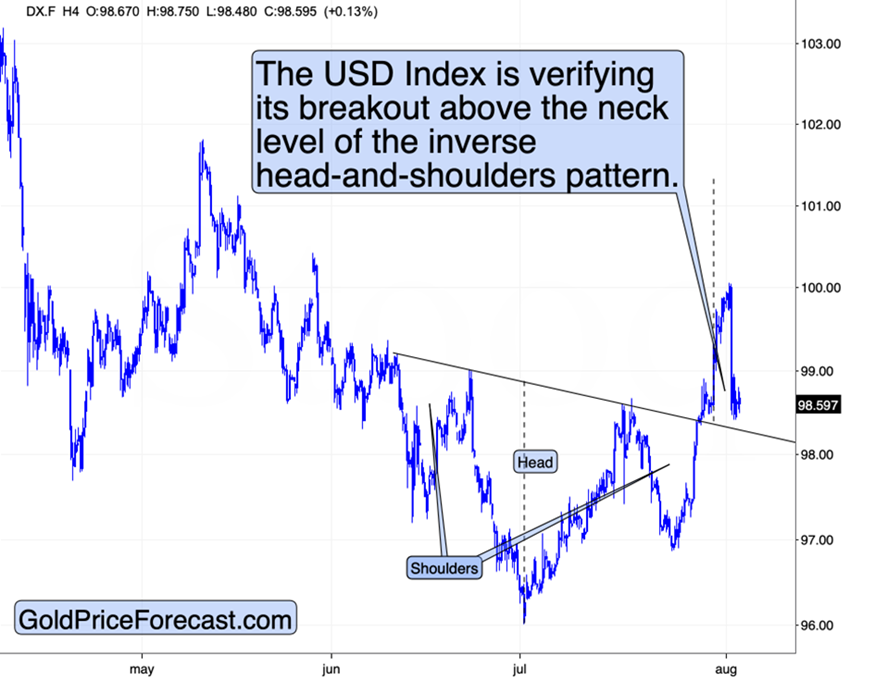
I previously described the inverse head-and-shoulders pattern in the USD Index and its bullish implications (the USDX is likely to rally to at least 101.3 above it). Today, I’d like to add that those patterns tend to be verified by a move back to the neck level. This is what we saw recently.
The USD Index moved back to its July high and to the neck level (approximately) of the inverse H&S formation.
The breakouts are being verified – this is completely normal.
Meanwhile, stocks are also taking a breather after taking a massive beating on Thursday and Friday.
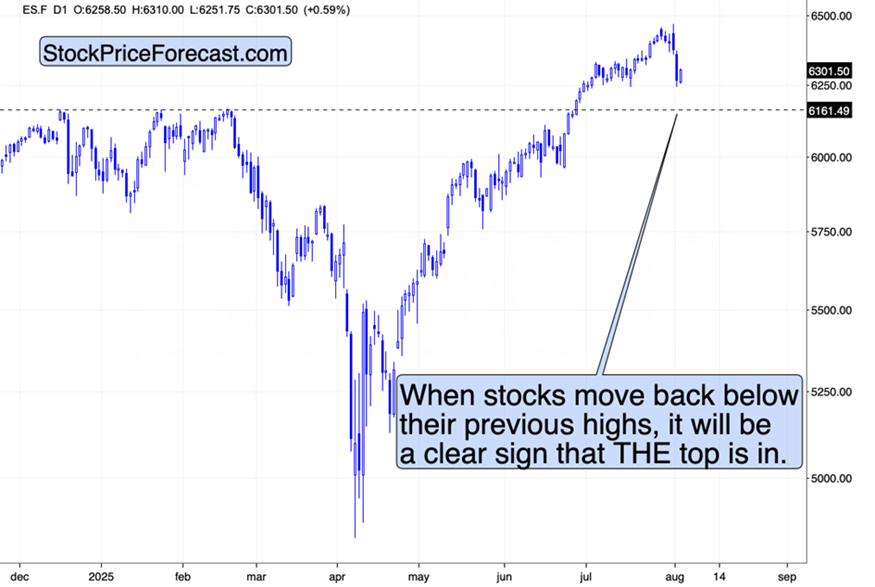
They consolidated above the 6,250 level for a few weeks, so it’s no wonder that this level provided short-term support. Still, let’s keep in mind that the S&P 500 is only one of the stock market indices.
Looking at the Dow futures provides a clearly bearish picture.
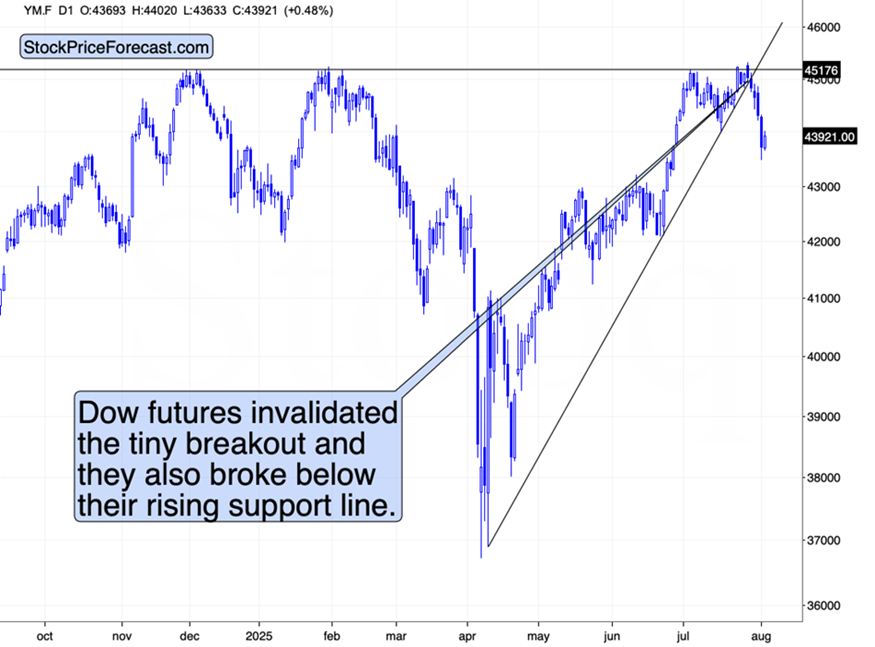
After failing to move above the previous highs, stocks declined (just as the Volatility Breakout System had forecasted) – also below their rising support line. This is a combination of two powerful bearish signals, and while we see a pause today, it looks like stocks can decline significantly any day now.
All signs point to 2008
Taking a step back from all this, doesn’t it all remind you of something? I mean, gold is holding up relatively well with significant volatility, the USD Index is starting to rally, with stocks that seem to be heading lower, and weak performance of mining stocks?
Yes – the current situation has a huge “2008” written all over it.
Want free follow-ups to the above article and details not available to 99%+ investors? Sign up to our free newsletter today!
Want free follow-ups to the above article and details not available to 99%+ investors? Sign up to our free newsletter today!
Author

Przemyslaw Radomski, CFA
Sunshine Profits
Przemyslaw Radomski, CFA (PR) is a precious metals investor and analyst who takes advantage of the emotionality on the markets, and invites you to do the same. His company, Sunshine Profits, publishes analytical software that any


