Gold miners slide over 5% but that’s just the beginning

GDXJ drops sharply in early trading
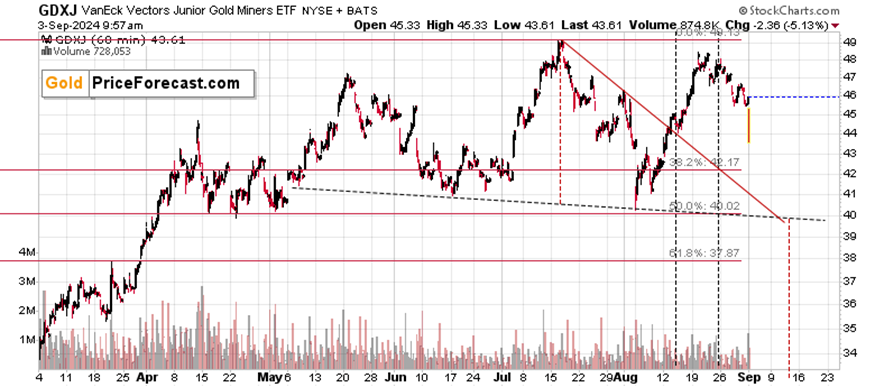
That’s less than 30 minutes of today’s trading from the opening bell. Yes, the GDXJ already plunged by over 5%, and yes, it’s a completely normal phenomenon, even though most investors were likely shocked by it. My subscribers weren’t because I had prepared them in advance for what’s likely to happen after the U.S. Labor Day, and I covered this important tendency in the article entitled Gold Price Forecast for September 2024.
In short, this is unlikely to be the end of the move, even if we see a quick pause after this sharp decline (but I wouldn’t bet on the pause taking place – the slide could just as well continue).
Today’s decline is significant not only because it confirms the post-U.S.-Labor-Day tendency in gold, but also because it’s another step toward creation of a bearish head-and-shoulders top formation.
You see… Since the GDXJ didn’t move above its July high, but rather topped slightly above its May high, (and given that the next big decline is likely just around the corner) it seems that we’re seeing a head-and-shoulders pattern, with the May and August tops being shoulders and the July high being the head of the patterns.
The downside targets based on this formation are created by copying the height of the head and pasting it below the neck level, which I’ve done using red, dashed lines. This technique points to the target at about $33. We’ll know more when the GDXJ breaks below the neck level and it’s closer to this target – based on where gold, stocks, and the USD Index are. For now, however, its seems quite possible that the GDXJ will slide there before rebounding (and not from $34). The $34 level is more conservative, so I’m still basing my target on it (the first GDXJ chart from today’s analysis still supports it), so we’ll probably end up taking profits at about $34, anyway, but I wanted to share this bearish confirmation with you either way.
Miners are not the only market that’s declining substantially today, either.
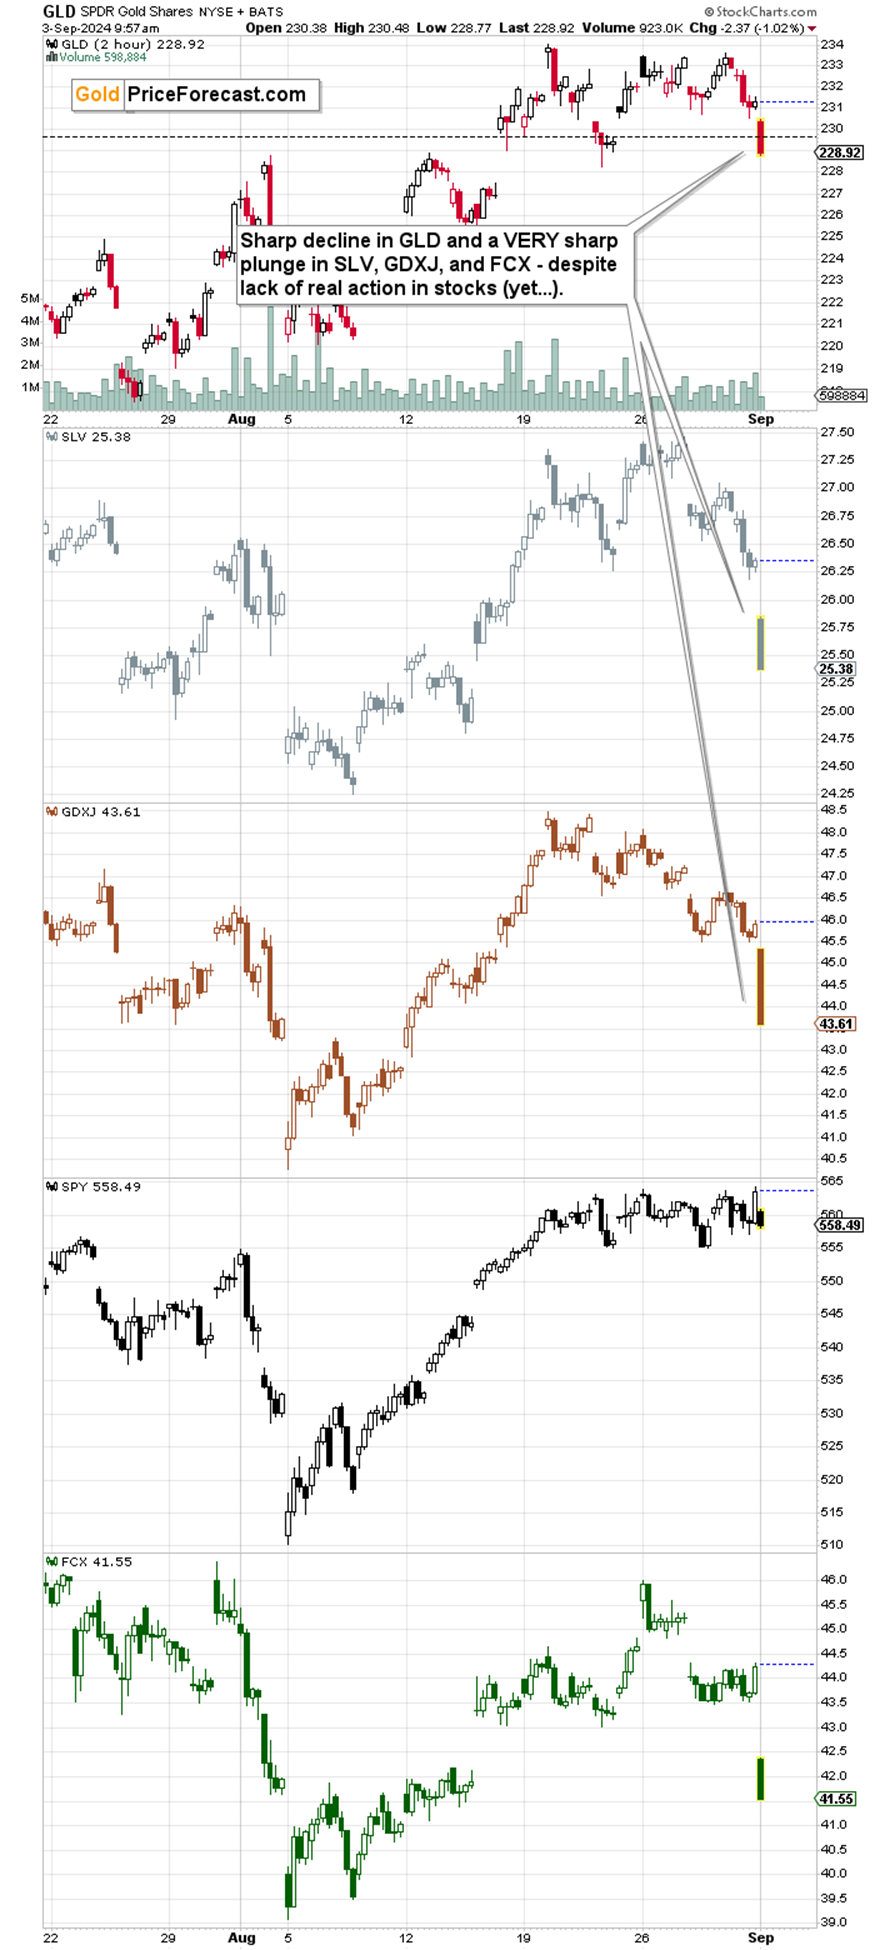
The GLD ETF declined in a notable but more measured way (declining “only” 1.02% while miners declined over 5%), the SLV ETF (proxy for silver) declined by about 3.7%, and the FCX shares moved lower by over 6%.
It’s all particularly bearish for commodities and precious metals (and miners) as it’s happening with very little help from the general stock market (which is down only a bit) and the USD Index (which is generally flat today).
Post-labor day Gold decline
I previously wrote that the lack of declines in gold despite rallies in the USDX was not that surprising as they might have been delayed due to gold’s tendency to slide after U.S. Labor Day. Quoting my yesterday’s Gold Trading Alert:
Besides, gold had a very good reason to decline just moderately last week – it was likely waiting for the U.S. Labor Day (Monday), to slide shortly thereafter, just like what it’s been doing after this holiday in almost all recent cases.
And speaking of the USD Index, did you notice that last week we saw the biggest weekly rally in the USD Index since the first half of April?
It’s an extremely important medium-term buy sign not just because of the size of the rally, but because it means that the USD Index verified its breakout above the declining support line.
Here’s what I mean:
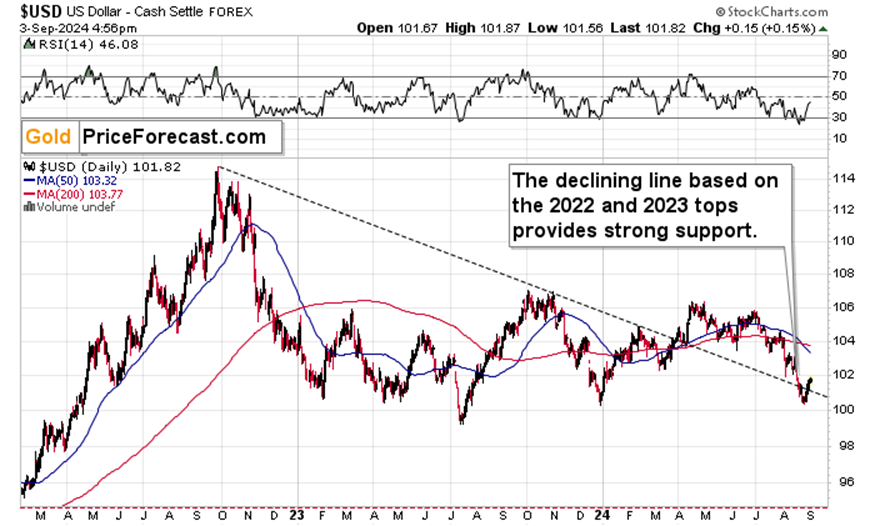
That’s the chart that I previously described in the following way:
„The above-mentioned declining, medium-term resistance line was just touched. Combining this with the extreme reading from the RSI makes the outlook particularly bullish, even if we didn’t consider the previously mentioned points.
And yes, when the USD Index bottomed in mid-2023, the precious metals sector topped. The same likely happened now.
After moving briefly below the declining support line, the USD Index moved higher – thus verifying the breakout above it. This, plus the position of the RSI makes the outlook very bullish and given this week’s gold’s weakness relative to what happened in the USD Index, the above is likely to trigger declines in the yellow metal.”
After posting the above, the USD Index moved a bit lower and then soared back with a vengeance, closing the week clearly back above the declining support line. This, plus the fact that the RSI was just extremely bearish, creates a very bullish set-up.
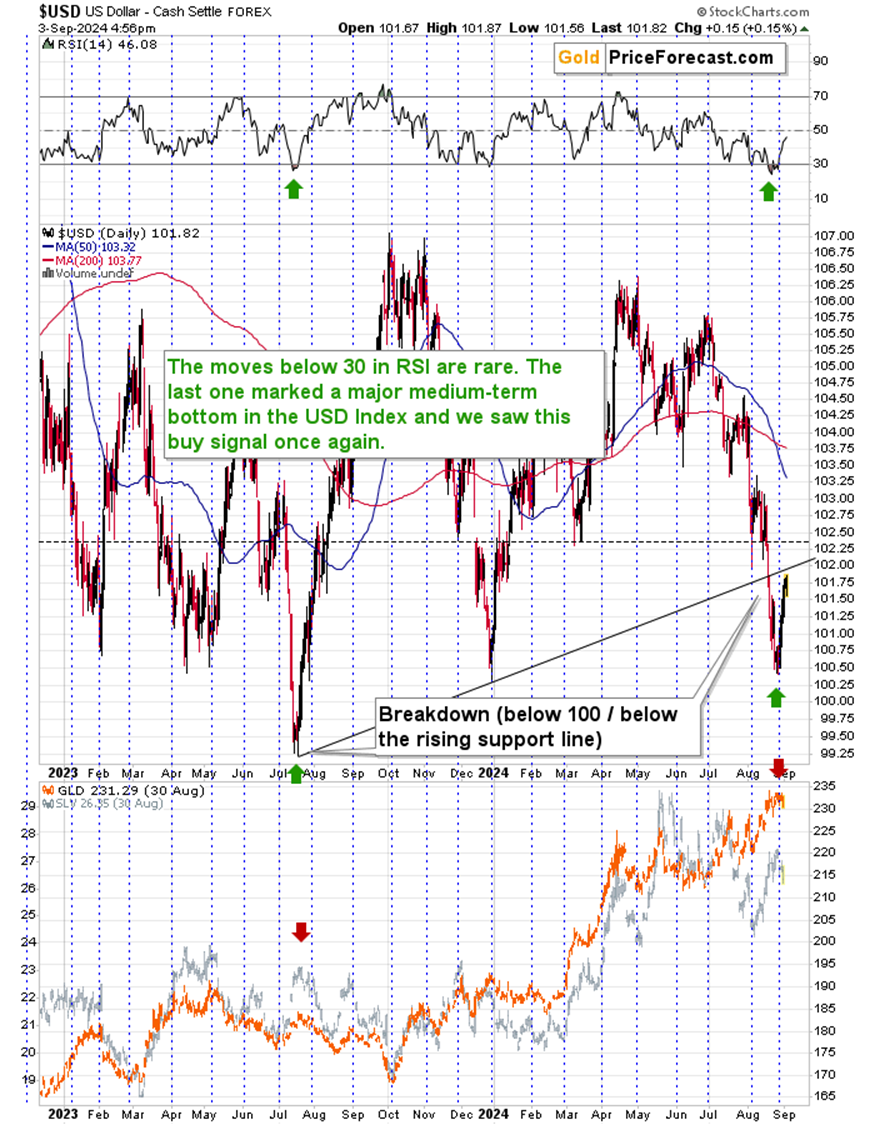
On a short-term basis, we see that the USDX is almost back at its rising resistance line. The RSI was similarly (extremely) oversold in mid-2023 and it was then after a breakdown below the previous yearly lows and the 100 level. This breakdown wasn’t invalidated immediately, but when it was, the rally that followed was substantial. And guess what, gold didn’t slide immediately after USDX’s bottom – the decline was slightly delayed.
This is very much in tune with what we saw recently. The USD Index is early in its rebound (even though it did rally over 1 index point last week) and gold declined just a bit – it’s just like in mid-2023. Also, silver moved lower in a more decisive manner, which is also in tune with mid-2023.
All in all, gold price forecast for September 2024 is bearish as a very powerful tendency just started to come into play and we saw bearish confirmations from junior mining stocks (they are very weak) and we have a bullish situation in the USD Index, which tends to move in the opposite direction to gold (at least in case of big moves).
Want free follow-ups to the above article and details not available to 99%+ investors? Sign up to our free newsletter today!
Want free follow-ups to the above article and details not available to 99%+ investors? Sign up to our free newsletter today!
Author

Przemyslaw Radomski, CFA
Sunshine Profits
Przemyslaw Radomski, CFA (PR) is a precious metals investor and analyst who takes advantage of the emotionality on the markets, and invites you to do the same. His company, Sunshine Profits, publishes analytical software that any


