|

Gold may be on verge of another selloff because of this bearish pattern [Video]

The uptrend of Gold has ended since a Wyckoff change of character bar showed up on 9 May 2022 after a climactic run-up, as explained in my video earlier. This is a key concept of the Wyckoff method to identify a change of the trading environment, which is applicable to all instruments like Gold, stocks, indices futures, crude oil, etc…Watch the video below.

Since then, Gold has been consolidating between 1900-1960 for slightly more than a month. Sign of weakness showed up after confirmation of a Wyckoff upthrust on 19 April 2022 followed by a break below the support at 1900 with a selloff tested 1800 with increasing of volume.

After an automatic rally off the low at 1800, Gold has been consolidating between 1838 and 1870 as shown in the chart below.

Chart

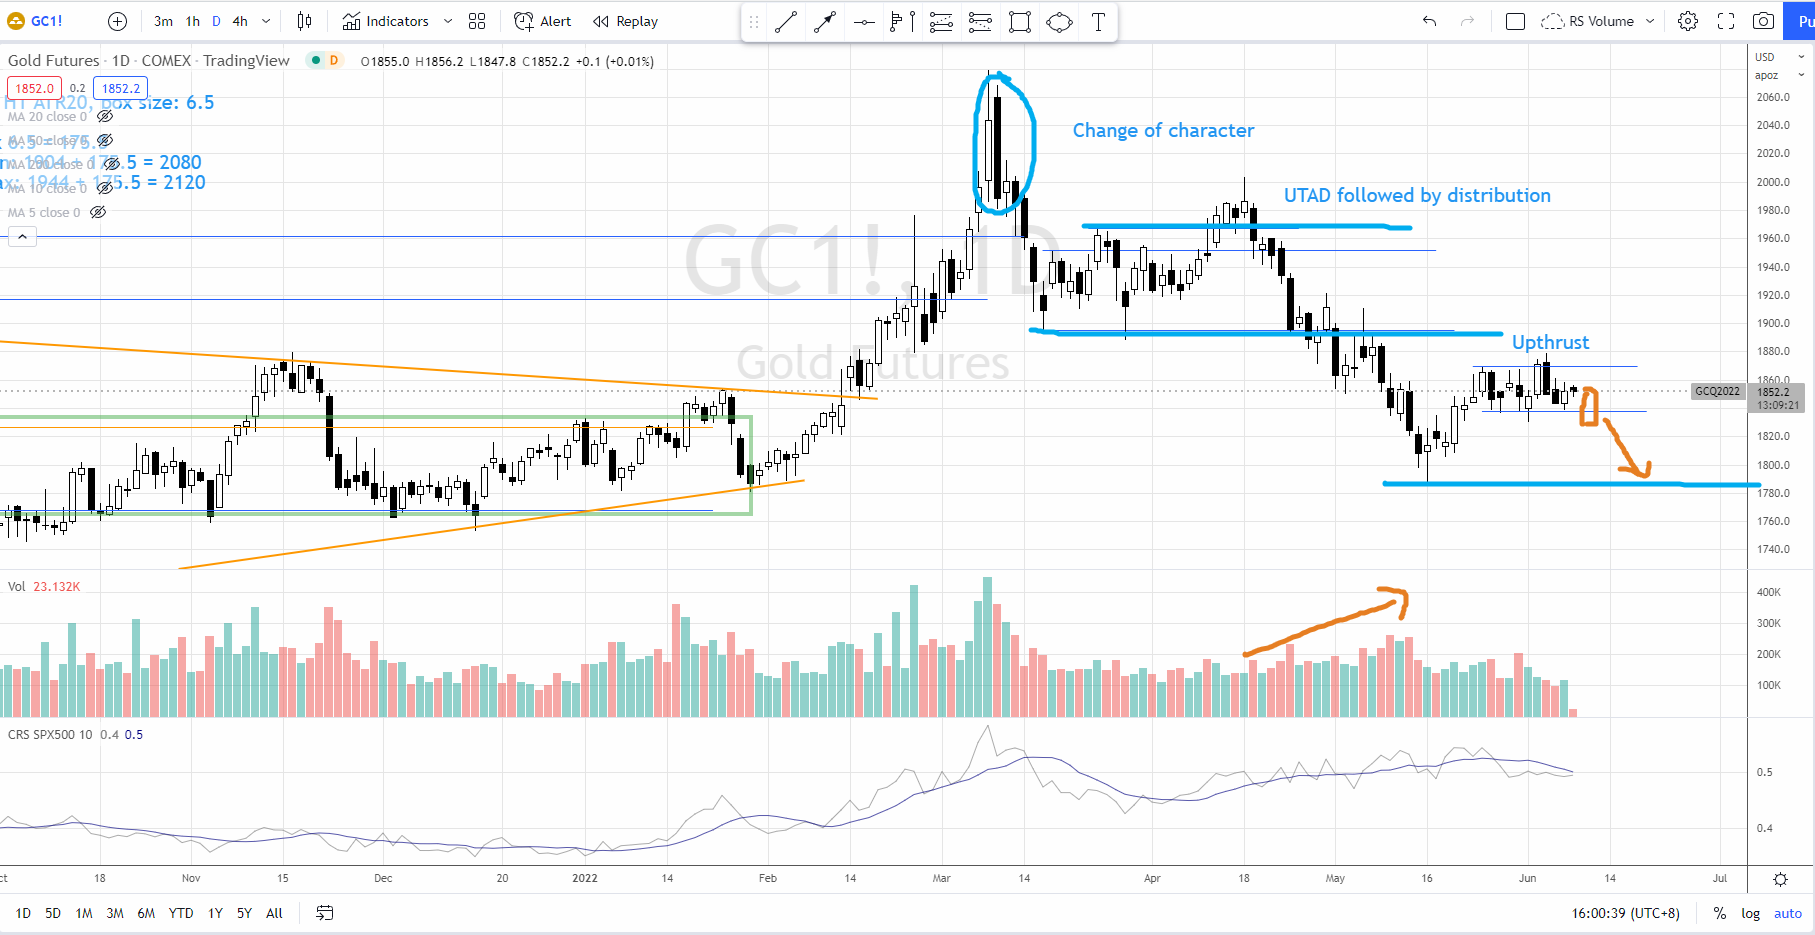
On 3 Jun 2022 a Wyckoff upthrust showed up in Gold followed by a reaction tested the support at 1837. Although the upthrust was not accompanied by high volume suggested non-threatening supply, poor demand could also cause Gold to break below the support.

Since Gold broke below the support at 1900 in May 2022 comes with increasing of supply (as annotated in the volume pane), it is likely to be tested.

Should Gold break below the immediate support at 1837, a test of 1800 can be expected (as annotated in orange). Gold is expected to consolidate between 1800-1870 in the short-term.

Author

Ming Jong Tey

Ming Jong Tey

Independent Analyst

Ming Jong Tey has been trading since 2008. He started his learning journey from technical analysis (indicators, Fibonacci, etc...) to value investing. Throughout his journey, he develops an interest in price action with chart pattern trading.

More from Ming Jong Tey
Share:

Editor's Picks

EUR/USD: Bears retain control below 1.1780-1.1770 confluence breakpoint

The EUR/USD pair remains on the back foot through the Asian session on Friday and currently trades just above mid-1.1700s, well within striking distance of a nearly one-month low set the previous day.

GBP/USD seems vulnerable near one-month low vs. USD as traders await US data

The GBP/USD pair prolongs its weekly downtrend for the fifth consecutive day on Friday and slides back closer to a nearly one-month low, touched the previous day. Spot prices trade below mid-1.3400s during the Asian session on Friday and seem vulnerable to slide further as traders now look to important US macro data for a fresh impetus.

Gold eyes next breakout on US GDP, PCE inflation data

Gold sticks to recent gains around the $5,000-mark early Friday, biding time before the high-impact US macro events. The focus is now on the US fourth-quarter Gross Domestic Product, core Personal Consumption Expenditures Price Index and the Supreme Court’s ruling on President Donald Trump’s tariffs.

Bitcoin, Ethereum and Ripple remain range-bound as breakdown risks rise

Bitcoin, Ethereum, and Ripple are trading sideways within consolidation ranges on Friday, signaling a lack of directional bias in the broader crypto market. BTC rebounded from key support, and ETH is nearing the lower consolidation boundary, while XRP is holding at its lower trendline boundary. 

Hawkish Fed minutes and a market finding its footing

It was green across the board for US Stock market indexes at the close on Wednesday, with most S&P 500 names ending higher, adding 38 points (0.6%) to 6,881 overall. At the GICS sector level, energy led gains, followed by technology and consumer discretionary, while utilities and real estate posted the largest losses.

Injective token surges over 13% following the approval of the mainnet upgrade proposal

Injective price rallies over 13% on Thursday after the network confirmed the approval of its IIP-619 proposal. The green light for the mainnet upgrade has boosted traders’ sentiment, as the upgrade aims to scale Injective’s real-time Ethereum Virtual Machine architecture and enhance its capabilities to support next-generation payments.